Fig. S2.
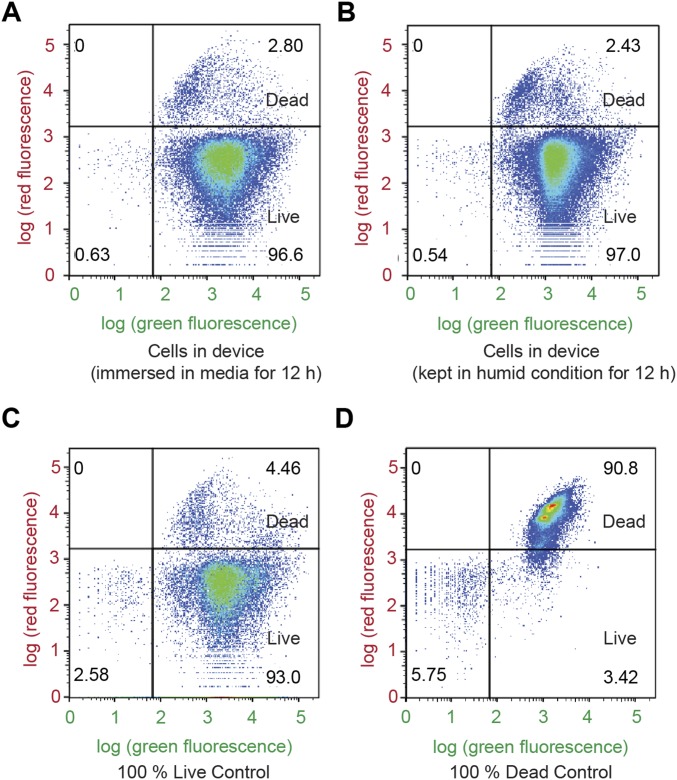
Flow cytometry analysis using live/dead stains for (A) cells retrieved from the living device that has been immersed in media for 12 h, (B) cells retrieved from the living device that has been placed in humid environment for 12 h, (C) live-cell controls, and (D) dead-cell controls. Green fluorescence denotes both live and dead bacteria, and red fluorescence denotes bacteria that have been damaged and leaky membranes. The distributions of the live and dead populations are illustrated in the plots, with thresholds determined by controls. Over 95% of cells in the hydrogel–elastomer devices immersed in media or placed in humid chamber remained viable after 12 h.

