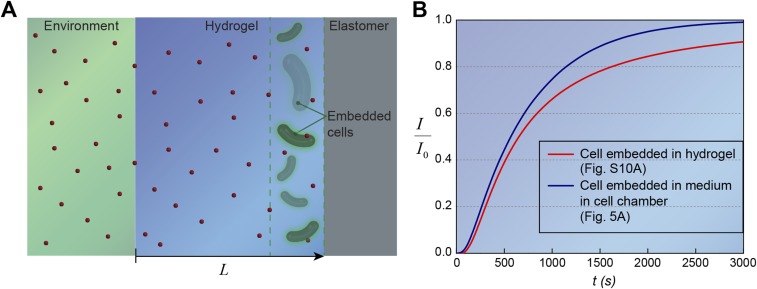
Fig. S10.
Calculation of critical diffusion timescales for living materials and devices. (A) Schematic illustration of signaling molecule diffusion from the environment through the hydrogel in the living device. Cells were embedded in a segment of the hydrogel close to the elastomer wall. (B) Comparison of typical inducer concentration profiles when cells were embedded in hydrogel [] vs. cells in medium of the cell chamber []. Despite small deviation () because of the diffusivity differences between hydrogel and medium and distance variation in two cases, it can be seen that the profile in the simplified model can consistently represent the typical concentration profile in the cell chamber of the living sensor at any time.

