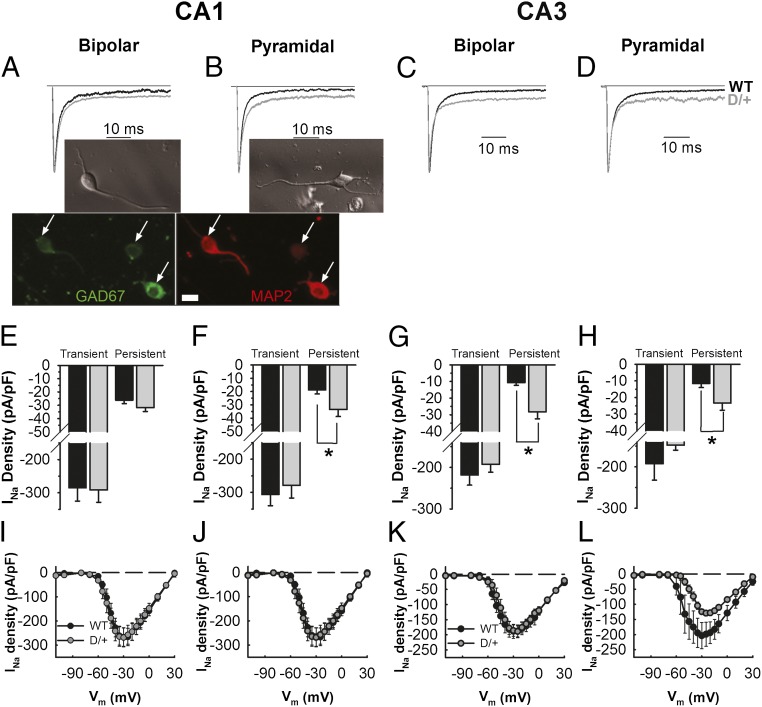
Fig. 1.
Changes in transient and INa,P density in Scn8aN1768D/+ neurons. (A–D) Normalized, representative INa traces in CA1 or CA3 bipolar or pyramidal neurons from WT (black) or Scn8aN1768D/+ (gray) mutant mice. (Insets) (A) Representative bright field image of a bipolar neuron (Upper); immunostaining showing MAP2-positive neurons with bipolar morphology are GAD67 positive (Lower). (Scale bar: 10 µm.) (B) Representative bright field image of a pyramidal neuron. (E) Average transient and persistent INa densities for CA1 bipolar neurons from WT (black, n = 11, N = 5) or Scn8aN1768D/+ (gray, n = 12, N = 8). (F) Average transient and INa,P densities for CA1 pyramidal neurons isolated from WT (black, n = 11, N = 5) or Scn8aN1768D/+ (gray, n = 10, N = 7). (G) Average transient and INa,P density for CA3 bipolar neurons from WT (black, n = 12, N = 9) or Scn8aN1768D/+ (gray, n = 11, N = 5). (H) Average transient and INa,P densities for CA3 pyramidal neurons isolated from WT (black, n = 9, N = 6) or Scn8aN1768D/+ (gray, n = 10, N = 8). (I) Averaged current–voltage relationships for CA1 bipolar neurons isolated from WT (n = 11, N = 5) or Scn8aN1768D/+ (n = 11, N = 8). (J) Similar to I but for CA1 pyramidal neurons from WT (n = 11, N = 4) or Scn8aN1768D/+ (n = 9, N = 7). (K) Averaged current–voltage relationships for CA3 bipolar neurons isolated from WT (n = 10, N = 9) or Scn8aN1768D/+ (n = 9, N = 5). (L) Similar to E but for CA3 pyramidal neurons from WT (n = 8, N = 5) or Scn8aN1768D/+ (n = 8, N = 6). N, number of animals; n, number of cells. Error bars indicate SEM. *P < 0.05.

