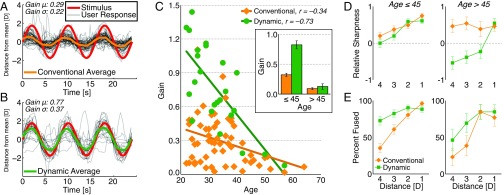
Fig. 3.
(A and B) Accommodative responses were recorded under conventional and dynamic display modes while users watched a target move sinusoidally in depth. The stimulus was shown for 4.5 cycles, and the response gain was calculated as the relative amplitude between the response and stimulus for 3 cycles directly after a 0.5-cycle buffer. The stimulus position (red), each individual response (gray), and the average response (orange indicates conventional focus and green indicates dynamic focus in all panels) are shown with the mean subtracted for each user. Phase is not considered because of manual starts for measurement. (C) The accommodative gains plotted against the user’s age show a clear downward trend with age and a higher response in the dynamic condition. Inset shows means and SEs of the gains for users grouped into younger and older cohorts relative to 45 y old. (D and E) Average (D) sharpness ratings and (E) fusibility were recorded for Maltese cross targets at each of four fixed distances: 1–4 D. The x axis is reversed to show nearer distances to the left. Error bars indicate SE.

