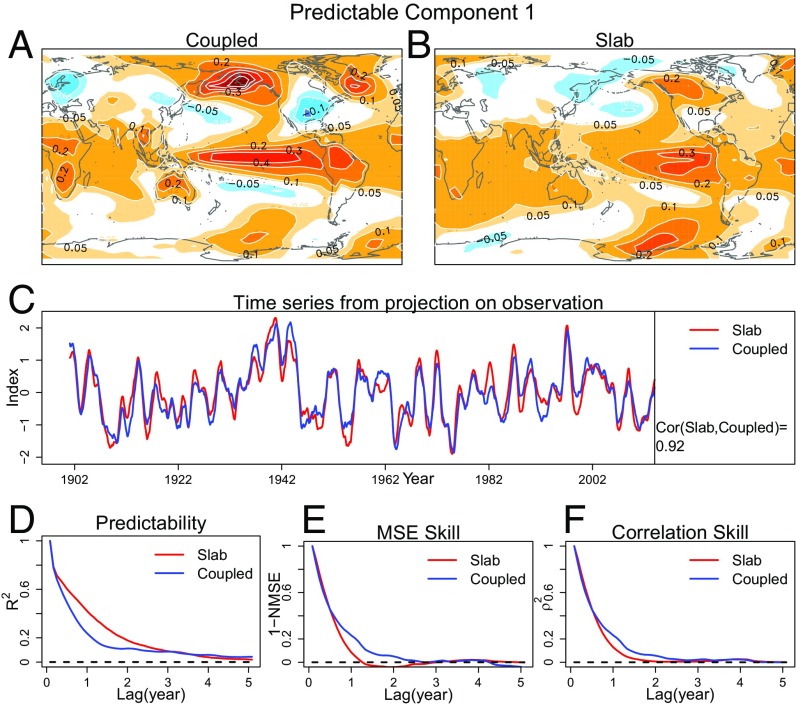
Fig. 1.
Most predictable component in coupled and slab models. Most predictable component is derived by maximizing the APT separately in coupled and slab models. (A and B) Spatial pattern of the most predictable component in the (A) coupled and (B) slab models. Each pattern is normalized such that the time series multiplied by the pattern gives the temperature variations (in degrees Celsius) due to this component. (C) Projection of the most predictable pattern onto monthly observed SST, smoothed with a 1-y running mean (blue and red curves, respectively). The correlation between coupled and slab projected time series is indicated in the bottom right legend. (D) The predictability (Eq. 3) of a linear prediction model that predicts the component in dynamical models. (E and F) The forecast skills (Eqs. 5 and 6) of a linear prediction model that predicts the component in observations. In D–F, the dashed line shows the mean-square error of a forecast based on the climatological mean. The time scale of the predictability and forecast skills is defined by the time (lag) when the red and blue curves intersect the dashed curve.

