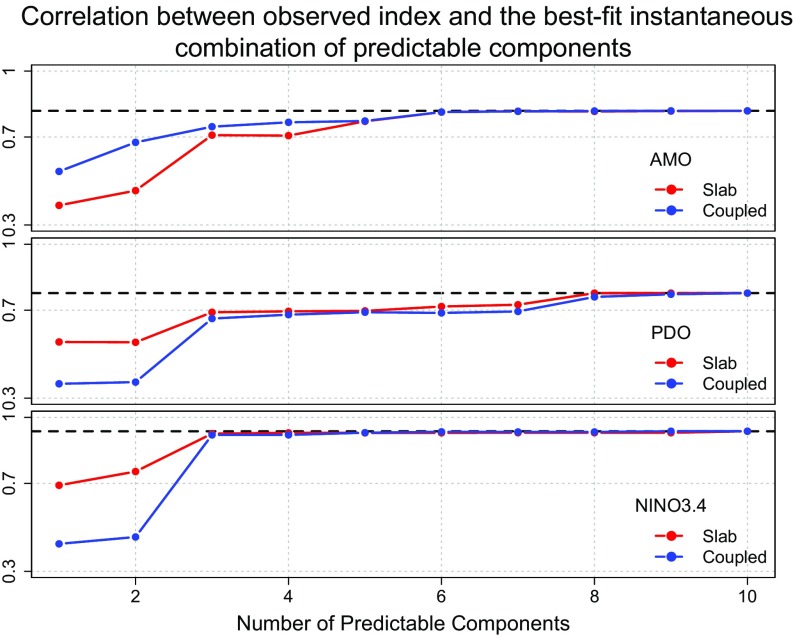
Fig. 4.
Correlation between observed index and the best-fit instantaneous combination of predictable components. The correlation is computed using a 12-mo running mean for the observed index and for the best-fit instantaneous combination of predictable components. The horizontal axis shows the number of predictable components used to fit the observed index. The blue and red curves show results for coupled and slab predictable components, respectively. The black dashed line shows the maximum correlation when all 10 predictable components are used.

