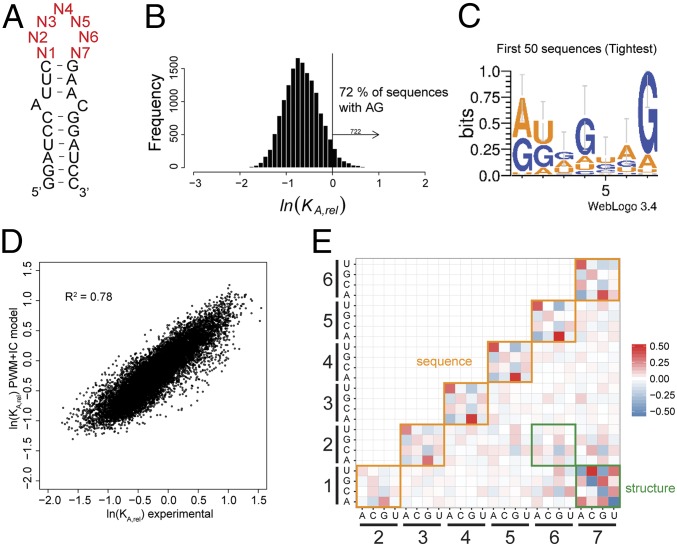
Fig. 2.
Determination of the affinity distribution for UP1 binding to all possible variants of the 7-nt SL3ESS3 apical loop. (A) Secondary structure of SL3ESS3 showing the constant base-paired stem loop and the randomized 7-nt apical loop region (red). (B) Affinity distribution of KA,rel values for UP1 binding to all possible sequence variants in the randomized pool of SL3ESS3 variants. The vertical line corresponds to the value for the reference native SL3ESS3 (lnKA,rel = 0). Seven hundred twenty-two variants bind with higher affinities than native SL3ESS3, of which 72% contain at least one 5′-AG-3′ dinucleotide. (C) Probability sequence logo calculated for the 50 highest affinity SL3ESS3 variants. (D) Comparison of experimental KA,rel values and KA,rel values predicted using a PWM model that includes interaction coefficients (IC values) between nucleobases. (E) Comparison of the IC values derived from fitting the KA,rel affinity distribution to Eq. S7 as described in SI Materials and Methods. The magnitude of the IC values is indicated by differences in color: red, positive interactions; blue, negative interactions.

