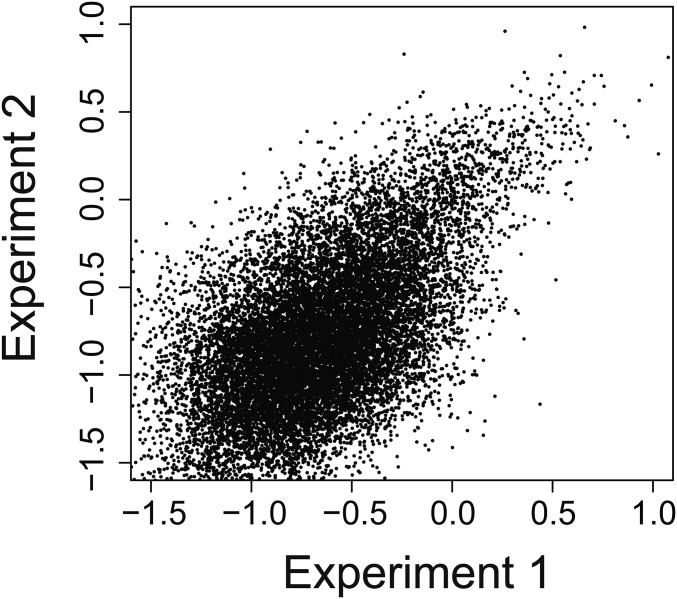
Fig. S3.
Comparison of ln(KA,rel) values obtained in two independent experiments. Individual KA,rel data points are compared as a dot plot for independently performed HTS-EQ of two unique 7-nt SL3ESS3 randomized apical loop populations. The depletion of bound species from the free population is quantified in HTS-EQ, and the greatest experimental error is observed for lower affinity sequence variants.

