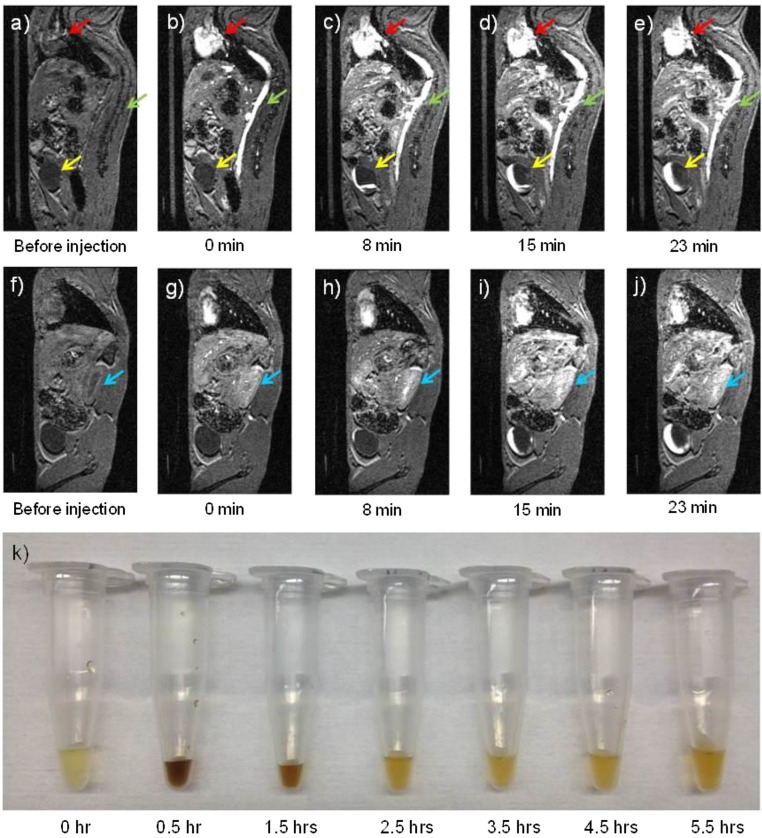
Fig. 4.
(A–J) T1-weighted MR images of a mouse injected with ZDS-coated exceedingly small SPIONs (ZES-SPIONs) at 7 T. Time points underneath each image: the time after ZES-SPIONs injection: (A–E) one sagittal slice showing the heart (red arrow), the vena cava (green arrow), and the bladder (yellow arrow), and (F–J) another sagittal slice showing the kidney (blue arrow); (K) urine samples from mice taken at different time points after injection showing renal clearance of ZES-SPIONs in vivo. Before the injection of ZES-SPIONs, the heart (red arrow), the vena cava (green arrow), and the bladder (yellow arrow) do not show appreciable positive contrast. After injection, the heart and the vena cava display high positive contrast immediately after injection. At 8 min after injection, the bladder displays some positive contrast, indicating an excretion of urine containing ZES-SPIONs. With the increase of time postinjection, Fig. 4 D and E shows that the positive contrast region of the bladder increases, suggesting an accumulation of urine with ZES-SPIONs.

