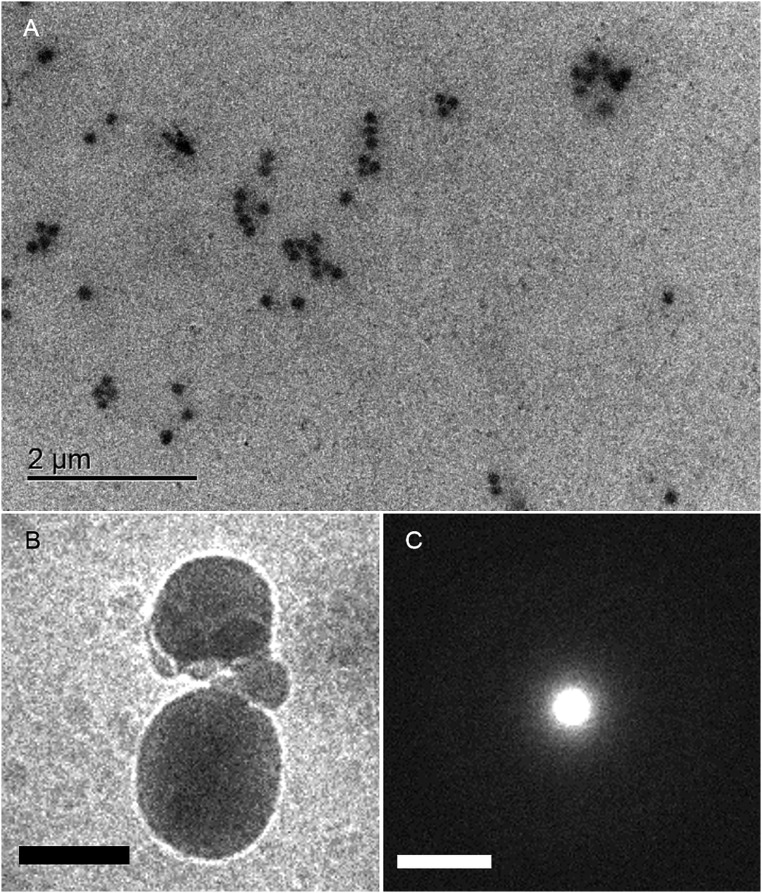
Fig. S3.
Representative TEM images of ASP. (A) Bright-field in situ TEM image of dispersed ASPs in the liquid cell. The mean diameter of the ASPs in the solution was calculated from the number and total area of the ASPs, assuming that each ASP is a sphere. (B) Cryo-TEM image of ASPs and (C) corresponding electron diffraction pattern. The halo pattern shows amorphous structure of the particles. (Scale bars: 200 nm in B and 2 nm−1 in C, respectively.)

