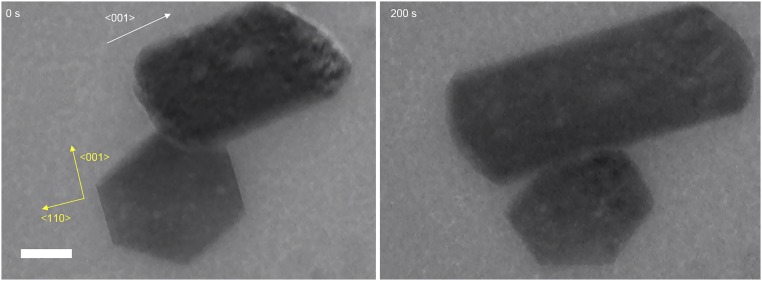
Fig. S4.
The stabilities of the observed crystal phases. Bright-field in situ TEM images show an orthorhombic (Upper) and a tetragonal (Lower) lysozyme crystals at 0 and 200 s. The orthorhombic crystal grew by about 400 nm in the <001> direction (white arrow). In contrast, the tetragonal crystal dissolved by about 70 nm in the <001> direction (yellow arrow) but did not grow or dissolve in the <110> directions. This image sequence demonstrates that the orthorhombic phase is more stable than the tetragonal phase under the tested experimental conditions. (Scale bar: 200 nm.)

