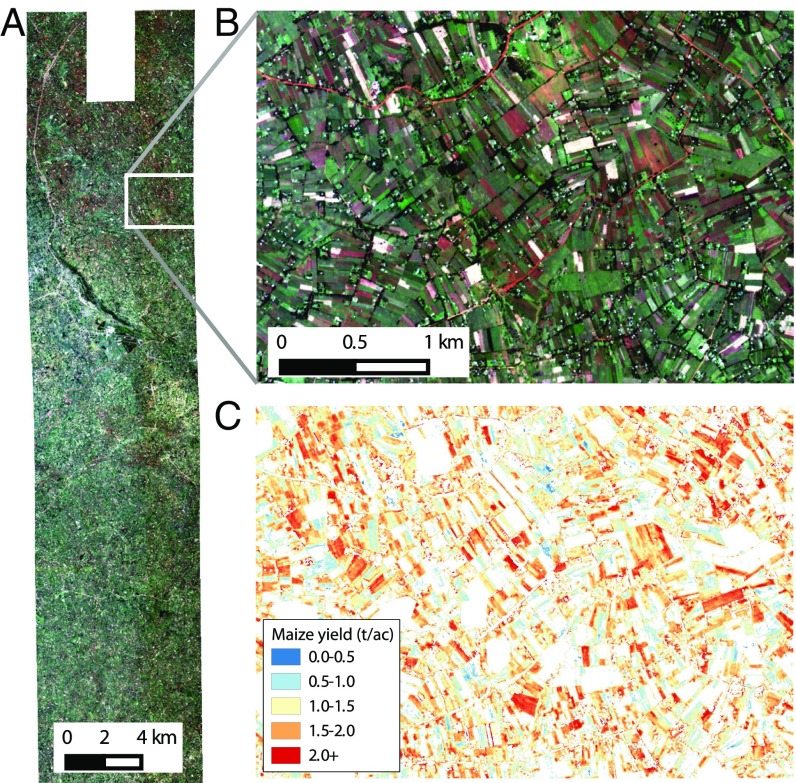
Fig. 5.
Maize yield map for the study region, 2015. (A and B) One-meter image from Terra Bella of the study region (A) and zoom-in of that image (B) (see Fig. S3 for a higher-resolution version). (C) Yield map of the zoomed-in region for pixels classified as maize.

