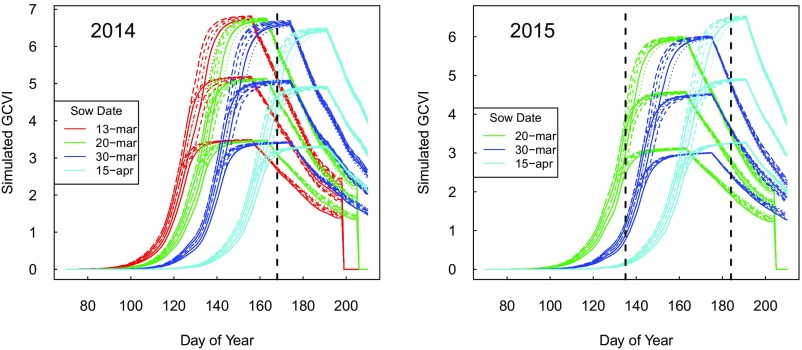
Fig. S4.
Simulated time series of canopy GCVI for each year for different management combinations, based on the APSIM-maize model. Colors represent different potential sow dates in each year, and individual lines represent different potential management combinations for that sow date. Vertical dashed lines show timing of actual images used for yield prediction.

