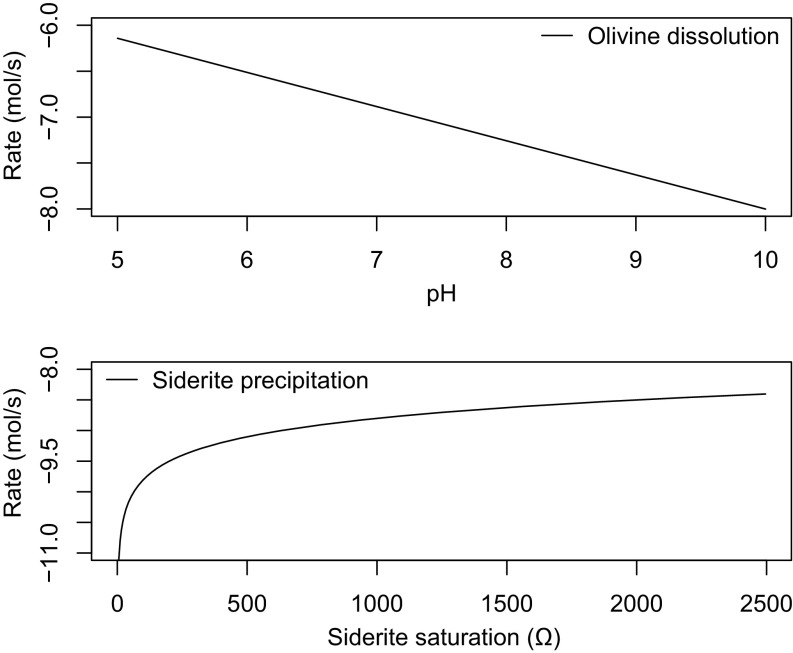
Fig. S3.
Comparison of olivine dissolution rates over a range of pH values with siderite precipitation rates at various values of Ω. SI Text, Comparison of Olivine Dissolution and Siderite Precipitation Kinetics describes details of how rates were derived.

