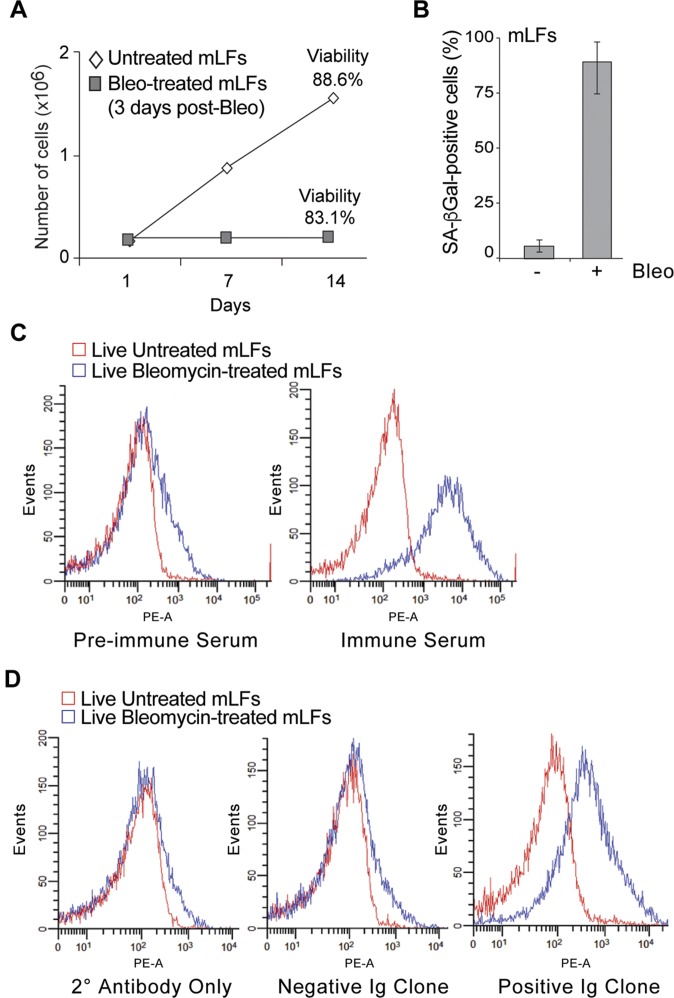
Fig. S1.
Isolation of antibodies following immunization with senescent cells. (A) Growth curve of untreated and bleomycin-treated (3-d postbleomycin) mLFs. Cellular viability was measured at the end of experiment (as indicated). (B) Quantification of SA-β-Gal+ mLFs following bleomycin treatment (14-d postbleomycin). Averages and SDs are from three independent experiments. An unpaired Student’s t test was used for statistical analysis. (C) Antibodies in the serum of nonimmunized (Left) and immunized (Right) Balb/C mice were incubated with live untreated (red) or bleomycin-treated (blue) mLFs and tested by FACS for binding efficacy. A representative example of this analysis shows a peak shift when incubated with senescent cells. (D) FACS analysis of live untreated (red) or bleomycin-treated (blue) BALB/c lung senescent stained with the supernatants from hybridomas generated from splenocyte fusions. Shown are representative examples of a negative control (secondary antibody only), the lack of a peak shift (i.e., a negative Ig clone) and a peak shift (i.e., a positive Ig clone) when incubated with senescent cells.

