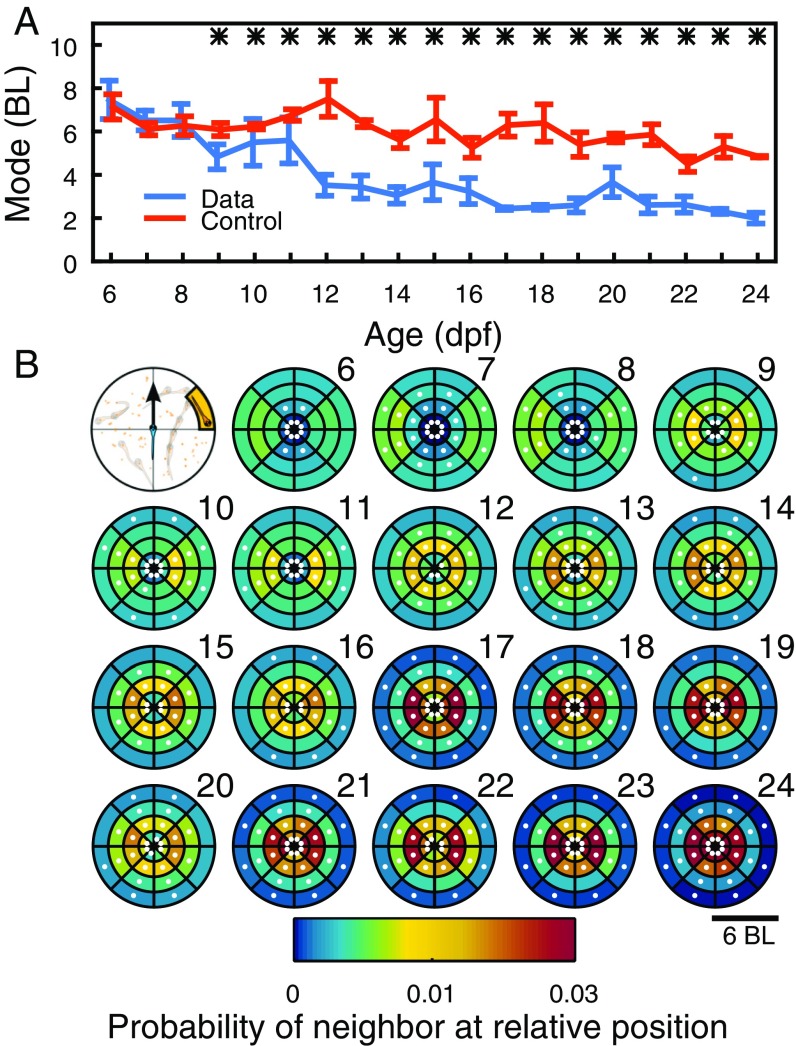
Fig. 2.
Development of distance and relative position between two fish. (A) Most likely distance between pairs of fish at ages 6 dpf to 24 dpf (blue), N = 4 to 12 pairs per day, and same for control randomized data (orange). Data are mean SEM. Stars indicate . (B) Focal animal is at the center of the coordinate system, with velocity vector pointing in the direction of y axis (top left). Other images show probability of finding second animal in space for ages 6 dpf to 24 dpf. Data are mean for each age, with age indicated by numbers 6 to 24. Dots indicate regions with .

