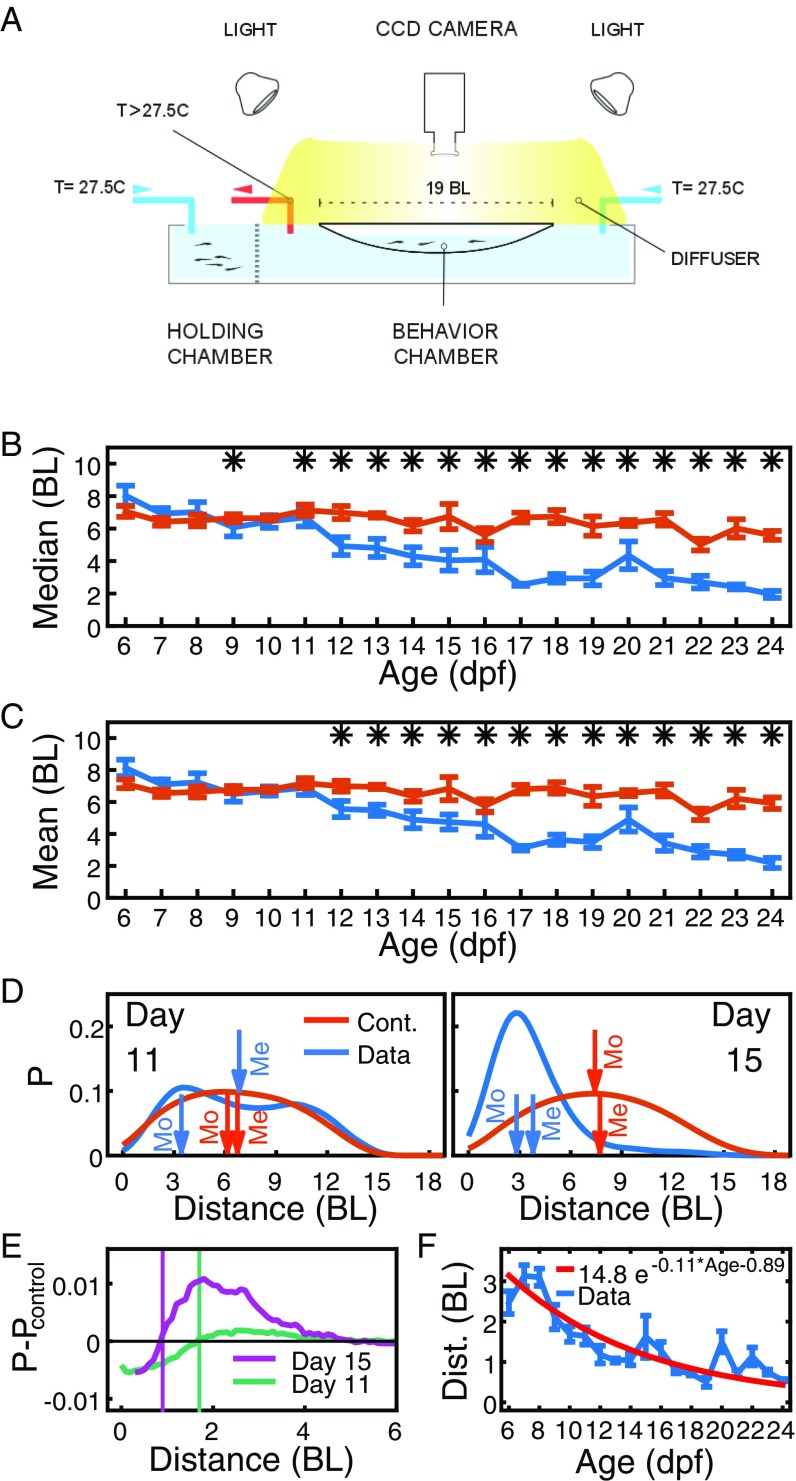
Fig. S1.
Setup, measuring interindividual distance and repulsion radius. (A) Experimental setup. (B) Median distance at ages 6 dpf to 24 dpf, averaged over 4 to 12 pairs of fish (blue) and control randomized data (orange). Error bars are SEM, *P < 0.05. (C) Same as B but for the mean distance. (D) Example distribution of interindividual distances for single trials on days 11 (left, blue) and 15 (right, blue), and the respective distributions from control randomized data (orange). Arrows indicate the mean (Me) and the mode (Mo). (E) Difference of distributions of distances and their controls for 11 dpf and 15 dpf. Vertical lines indicate the respective zero crossing. (F) Position of the zero crossing in the difference of distance distributions as shown in E at ages 6 dpf to 24 dpf (blue) and exponential fit (red). For E and F, distributions were obtained using kernel density estimation with an Epanechnikov kernel and a bandwidth of BL. Error bars are SEM. (All data are from group size two animals.)

