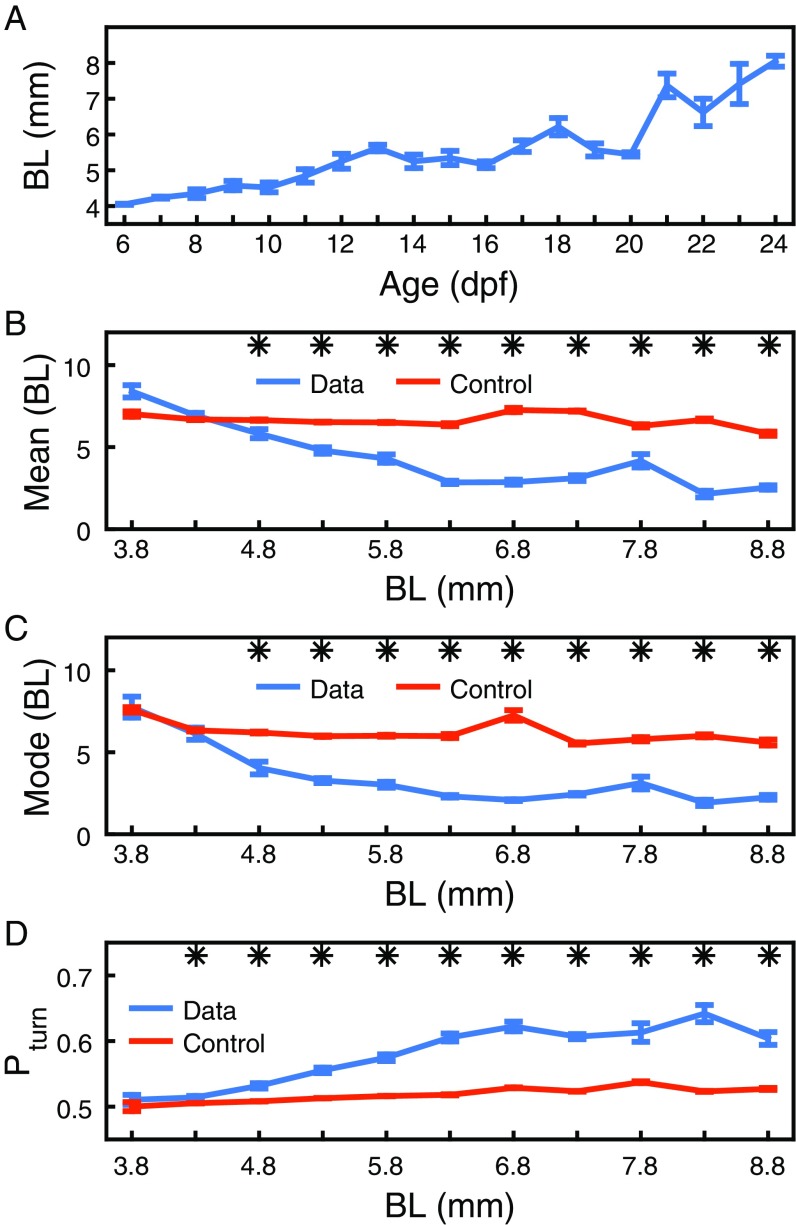
Fig. S3.
Development of distance and attraction versus BL. (A) BL at 6 dpf to 24 dpf. Error bars are SEM. (B) Mean distance computed from 2 to 19 pairs of fish with BL 3.8 mm to 8.8 mm (blue). Same is shown for control randomized data (orange). Error bars are SEM. *. (C) Same as B, but for the most likely distance. (D) Probability of accelerating toward the side on which the other animal in the pair is located (blue) and control randomized data (orange) for BL 3.8 mm to 8.8 mm. Error bars are SEM. Stars indicate days with .

