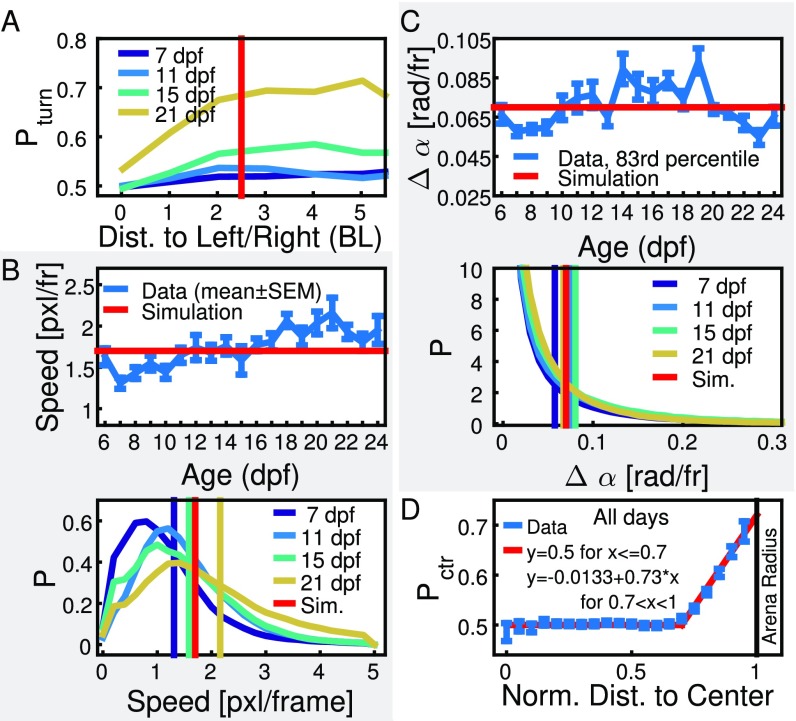
Fig. S6.
Extraction of parameter values for simulation. (A) Probability of an animal turning toward its conspecific versus interindividual distance for 7, 11, 15, and 21 dpf. The horizontal red line indicates the radius of reduced attraction = 2.5 BL used in the simulations and for filtering close neighbors in Fig. 4. (B) (Top) Average mean speed for each day. The horizontal red line indicates the step width chosen for simulations (s = 1.7 pixels per frame). Error bars are SEM. (Bottom) Distribution of speed for 7, 11, 15, and 21 dpf. Vertical lines indicate the mean. Distributions are unimodal, and the average mean as indicated by the vertical red line is chosen in simulations. (C) (Top) Average over the 83rd percentile of the turning angles for each day. Error bars are SEM. The horizontal red line indicates the angle used in the simulations ( = 0.07 rad per frame). (Bottom) Distribution of turning angles for 7, 11, 15, and 21 dpf. Distributions decrease continuously, and, for simulations, we choose a value that coincides with the 83rd percentile, as indicated by the vertical red line. (D) Average probability of an animal turning toward the center of the arena versus its normalized distance to the center. The red line indicates the approximation used in the simulations. Data of all age groups were pooled together. (Group size in A–C is two fish; group size in D is one fish.)

