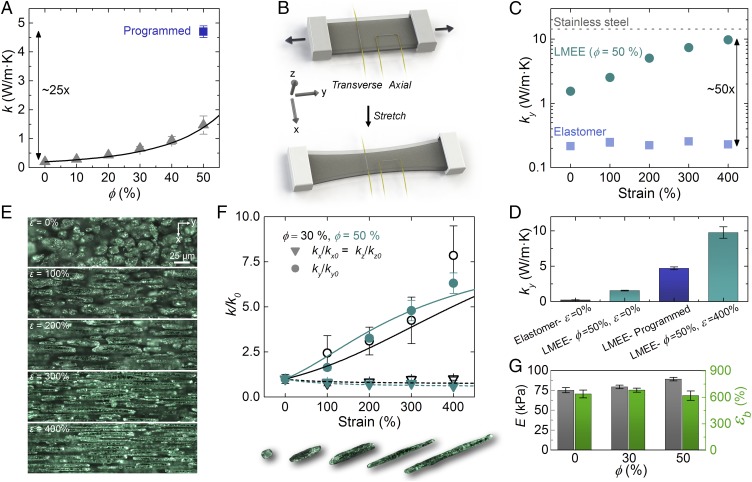
Fig. 2.
Thermal−mechanical behavior of the LMEE composite. (A) Thermal conductivity versus LM volume fraction (ϕ) in the stress-free state. The programmed sample refers to a composite that has been stretched to 600% strain and then relaxed to an unloaded state. Here the symbols are the experimental measurements, and the solid curve represents the theoretical prediction from the Bruggeman EMT formulation (n = 100 volume fraction dependence, n = 5 programmed samples). (B) Schematic of the THW method to measure anisotropic thermal conductivity under deformation. (C) Plot of thermal conductivity in the stretch direction versus strain for the elastomer and the LMEE composites. Upon stretching, the LMEE approaches the thermal conductivity of stainless steel and is 50× greater than the unfilled elastomer (n = 5). (D) Thermal conductivity comparison for different LM volume fractions (ϕ) and stress states (n = 5). (E) Optical micrographs of the 30% LMEE microstructure during stretching, with the images corresponding to 0 to 400% strain in 100% increments (from top to bottom). (F) Normalized thermal conductivity as a function of strain (blue open symbols are ϕ = 30%, and cyan closed symbols are ϕ = 50%; n = 5). The solid line represents the predicted behavior for the y direction, and the dashed line is the prediction for the x and z direction from our model. The images are representative images of the LM inclusions during the deformation process. (G) Mechanical properties of the LMEE composites with elastic modulus on the left axis and strain at break on the right axis (n = 3). All error bars represent ±1 SD.

