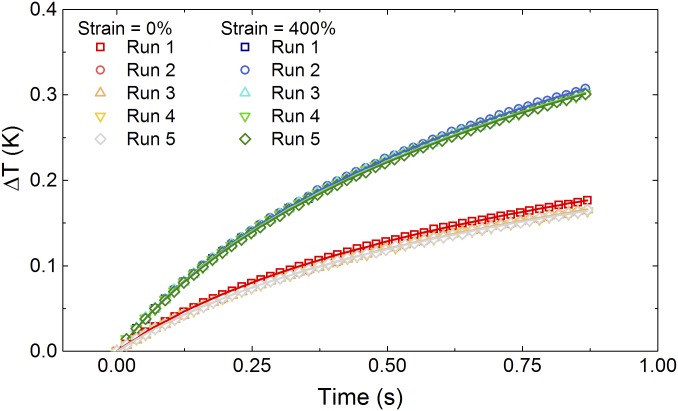
Fig. S3.
ΔT versus time for ϕ = 50% for the axial wire at ε = 0% and 400%, which demonstrates good agreement with the three-parameter fit explained in Methods, THW Testing. The symbols are the data points for each run, and the lines represent the corresponding three-parameter fit.

