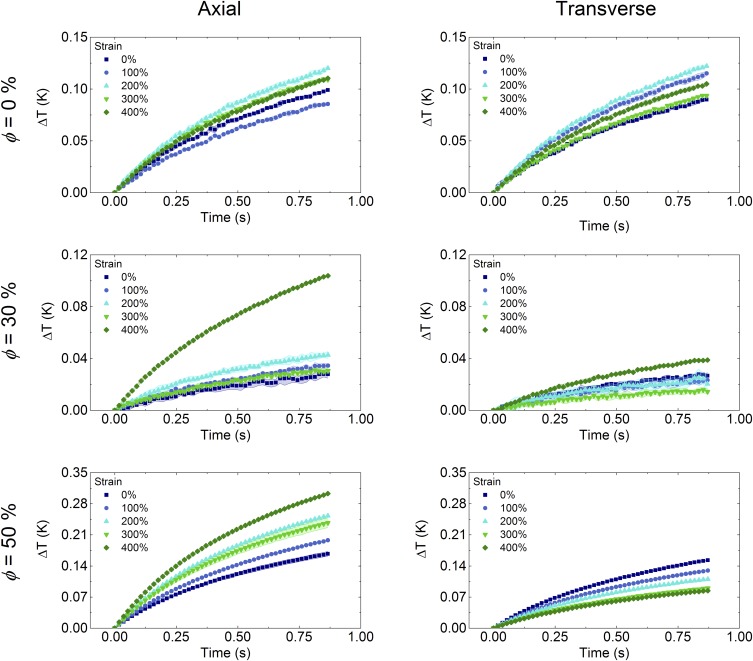
Fig. S4.
ΔT versus time of ϕ = 0%, 30%, and 50% for the axial and transverse wire up to 400% strain in 100% strain steps. Data symbols represent the average, and the shaded areas correspond to the SD for the five measurements for each condition. As noted in Methods, THW Testing, a current of 30 mA was applied on the ϕ = 30% experiments except at ε = 400% where 60 mA is applied, which explains the greater temperature rise for these data points relative to the other strain values. Hotwire lengths can vary between tests, resulting in a nonmonotonic temperature change across strain steps. This is accounted for by q, the volumetric heating of the wire per unit length, when calculating thermal conductivity.

