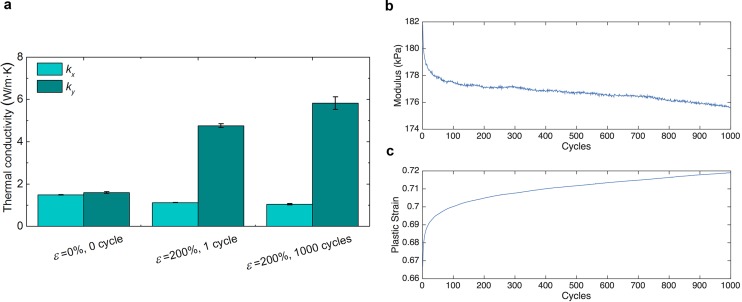
Fig. S6.
Cyclic testing. (A) Thermal conductivity for a ϕ = 50% composite tested at a strain (ε) of 0% and then stretched to 200%. The sample is then cycled 1,000 times up to a strain of 200%. Thermal conductivity is then evaluated after the 1,000 cycles at a strain of 200% (n = 5, error bars represent ±1 SD). (B) The 10% modulus and (C) induced plastic deformation as a function of number of cycles. The modulus slightly drops and plastic deformation slightly increases with number of cycles. The slight increase in the thermal conductivity ky could be attributed to the Mullins effect and permanently increasing aspect ratio of LM particles.

