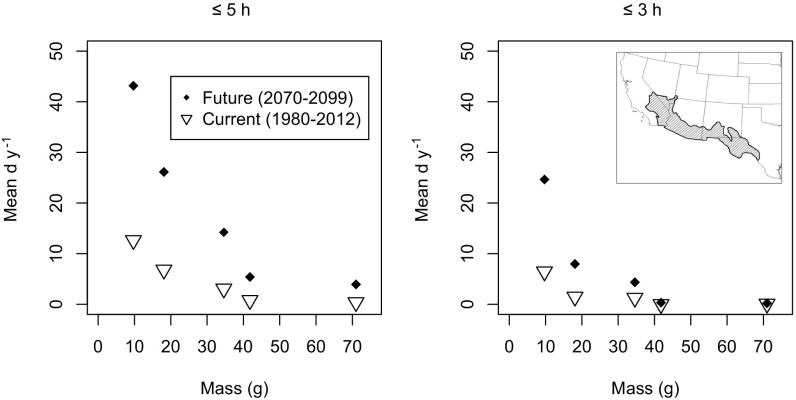
Fig. 4.
Average days per year with 5-h (Left) and 3-h (Right) lethal dehydration intensities in current and future climates. Averages are calculated over each species’ range within the US hot desert ecoregion, comprising the Mojave, Sonoran, and Chihuahuan deserts (ecoregion data from ref. 39).

