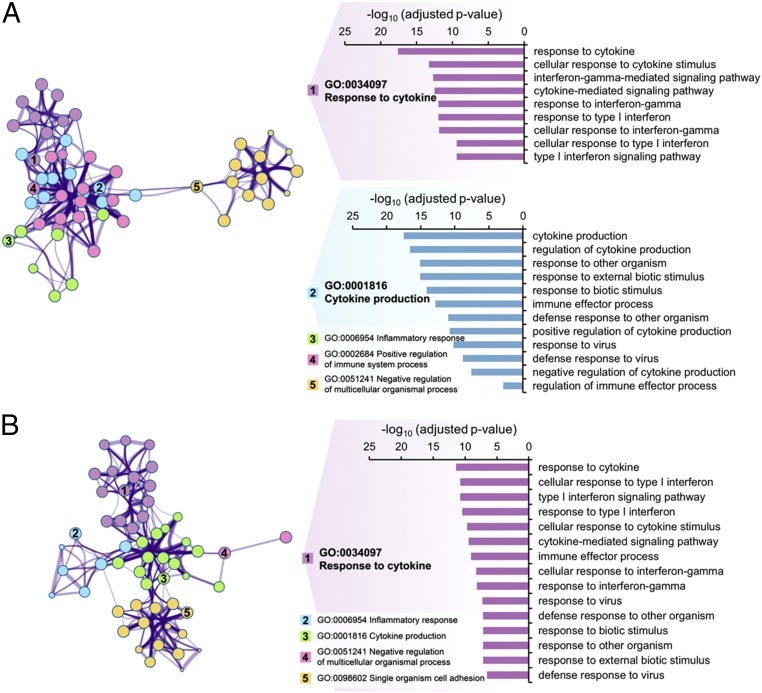
Fig. 3.
GO terms of genes associated with responses to pathogens and down-regulated in ESC-derived trophoblast cells relative to placenta-derived trophoblast cells. The figures represent clusters of related, enriched Biological Process GO terms of genes that showed strong significant down-regulation (q-value < 0.01, fold change > 4) in ESCd < 40 versus PHTu cells (A) and in ESCd > 70 versus PHTd cells (B). Note that these GO terms are related to responses to pathogens. The network view on thte Left represents GO categories by nodes; shared genes between nodes are linked by lines. The number of genes in a given GO category is represented by the size of the corresponding node, and the number of shared genes between two given GO categories is reflected by the thickness of the line that connects the nodes. Shown are the five most significantly enriched clusters, which are named in accordance with the most significantly enriched GO term within each one of the categories. Genes in GO categories Response to IFN gamma, Response to Type I IFN, and Defense response to virus are discussed in the text (see Fig. 4 for representative gene expressions). These genes are located either in cluster 1 or 2 in A, but all belong to cluster 1 in B. The bar graphs on the Right show enrichment significance of all GO categories that belong to these clusters. Enrichments for all GO terms within the shown clusters are presented in SI Appendix, Table S2.

