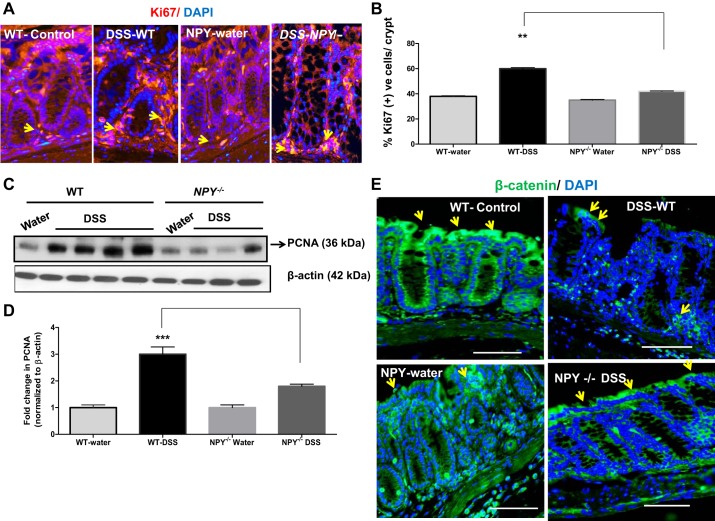
Fig. 2.
WT mice exhibit increased proliferation compared with NPY−/− mice. Inflammation-induced tumors were modeled in WT and NPY−/− mice as described in materials and methods. Upon euthanasia, the colons were fixed in paraffin, and tissue sections were immunostained for proliferative markers Ki67 or β-catenin. The percent of Ki67 positive cells per crypt were calculated based on total cells enumerated from DAPI nuclear staining. Images were captured using a Zeiss fluorescence microscope. Distal colon from WT and NPY−/− mice was also probed for proliferating cell nuclear antigen (PCNA) by Western blotting. A: representative colonic sections with Ki67 immunostaining; arrows represent Ki67 + DAPI positive cells. B: graphical representation of %Ki67 positive cells per crypt. C: Western blots depicting the PCNA levels in mice. D represents the histogram. E: representative colonic sections from mice to depict changes in localization of β-catenin (green) and DAPI (blue) by immunostaining. Magnification, ×20. Values are means ± SE; n = 3–4. Significant differences in WT-DSS compared with NPY−/−-DSS group: **P < 0.01, ***P < 0.001. Scale bar, 20 μm.

