Fig. 10.
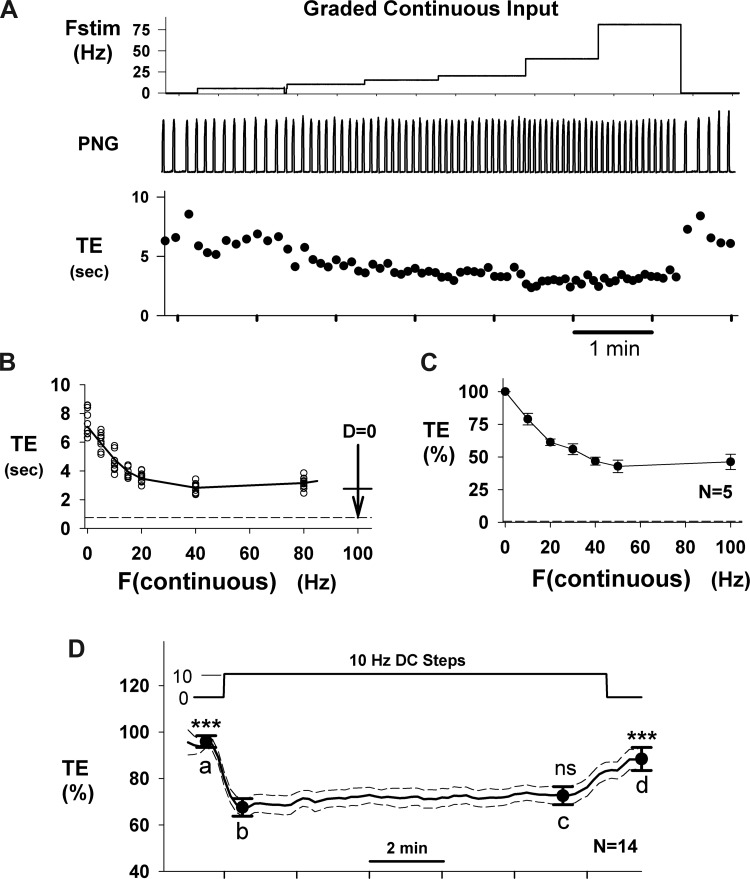
Te responses to continuous graded inputs exhibit desensitization. A: constant inputs for 8–12 cycles at frequencies of 5, 10, 15, 20, 40, and 80 Hz (Fstim; top) produce a graded decrease in Te with effectiveness that diminishes as frequency increases. B: plot of Te vs. stimulus frequency (F) shows a quasi-linear Te response for F ≤ 20 Hz. The length of the vertical arrow at F = 100 shows the magnitude of the Te change for the 1st cycle of the series of step inputs (Fig. 9A), and the horizontal line indicates the adapted Te level, which is similar to the Te level for 40- to 80-Hz continuous inputs. C: pooled data for normalized Te vs. continuous stimulus frequency from 5 dogs shows a quasi-linear relationship for F < 50 Hz. D: pooled Te responses (n = 14 dogs) to continuous 10-Hz stimulus for ∼10-min duration. Statistical comparisons (RM 1-way ANOVA) were made relative to point b, the initial step response. At 10 Hz, no significant desensitization was observed at point c (ns). Points a and d were significantly different from b (***P < 0.001). Te was decreased by 29.6 ± 3.4% by the 10-Hz step.

