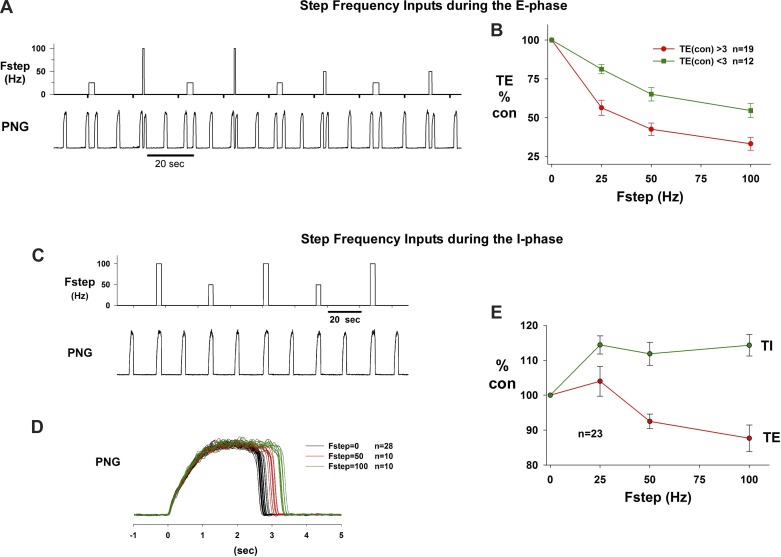
Fig. 4.
A: example of the step frequency (Fstep) protocol that produced graded shortening of Te for Fstep of 25, 50, and 100 Hz. B: plots of mean ± SE Te vs. Fstep show monotonic decrease in Te. Green, plots for 12 dogs where control Te was <3 s; red, plots for 19 dogs where control Te was >3 s. C: example protocol for Fstep inputs during the I phase. D: superimposed PNG traces from C show that Ti increased from ∼2.8 s to ∼3.4 s with no change in peak PNG. E: plots of group data for Ti and following Te vs. Fstep. See text for details.

