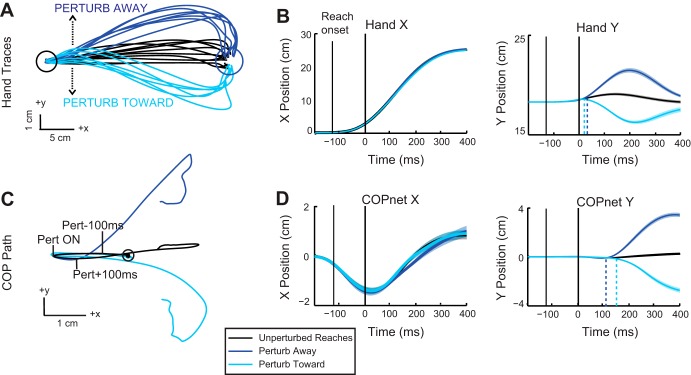
Fig. 2.
Kinematic traces when reaching to the circular target. A: hand trajectories for a representative participant depicting control reaches to the circular target (black traces) and reaching trials when the upper limb was perturbed away (dark blue traces) or toward (light blue traces) the body. B: group mean (solid trace) and SE (shaded area) of hand trajectories in the x (medial/lateral)- and y (anterior/posterior)-directions (color scheme as in A). All trials are aligned to perturbation onset (0 ms). Dashed lines represent onset of perturbation response calculated from ROC analyses. C: mean COP traces from the representative participant in A for reaches with and without a perturbation (color scheme as in A). Circle indicates the initial starting position of the COP, and tick marks indicate perturbation onset (Pert ON) and 100 ms before and after perturbation onset. D: group mean (solid trace) and SE (shaded area) COP trajectories in the x (medial/lateral)- and y (anterior/posterior)-directions aligned to perturbation onset (color scheme as in A). Dashed lines represent onset of perturbation response.

