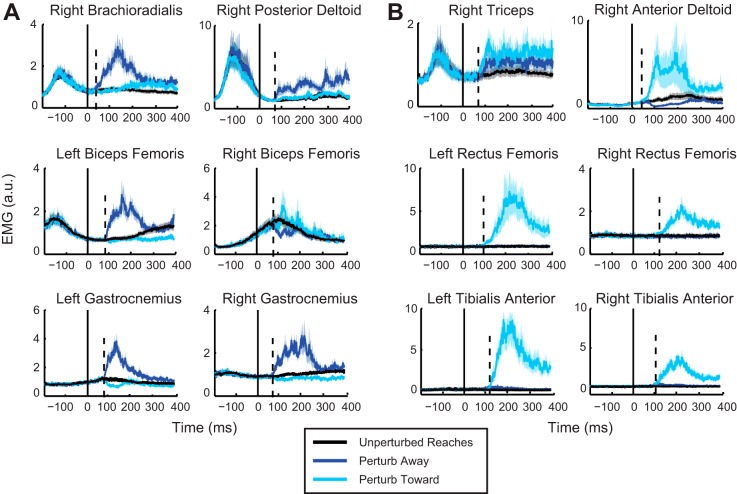
Fig. 3.
A: group mean (solid trace) and SE (shaded area) of EMG for the 6 muscles that responded primarily to the away perturbation direction. Responses for all muscles are shown for both perturbation directions, with activity for perturb away in dark blue and perturb toward in light blue. All trials are aligned to perturbation onset (0 ms). Dashed line represents the onset of the perturbation response as calculated from ROC analyses. B: group mean and SE of EMG for the 6 muscles that responded primarily to the toward perturbation direction (color scheme as in A). a.u., Arbitrary units.

