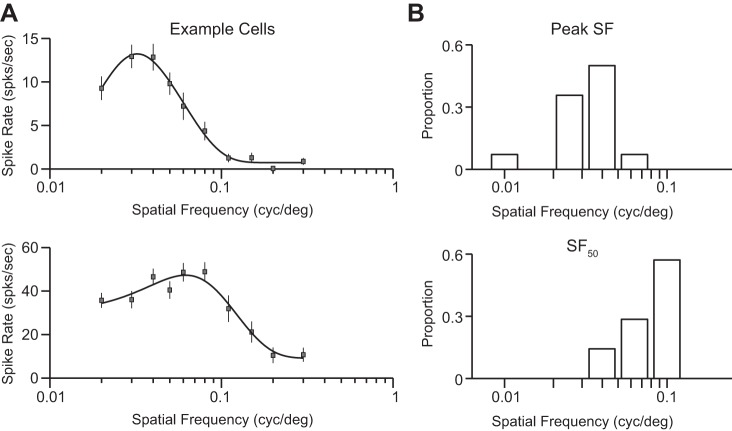
Fig. 2.
Spatial frequency sensitivity in predatory grasshopper mice. (A) Example tuning curves of spiking responses from two V1 neurons. Drifting gratings with optimal orientation, direction, and spatial location for each neuron were shown at varying spatial frequencies. Shown are mean cycle-averaged responses to each presentation of each oriented grating above the peak (Fo + F1) spiking responses. Curve fits are a Difference of Gaussians. (B) Distributions of the spatial frequency eliciting the largest responses (Peak, top) and the highest spatial frequency eliciting a spiking response 50% of the maximum responses (SF50, bottom).

