
Fig. 5.
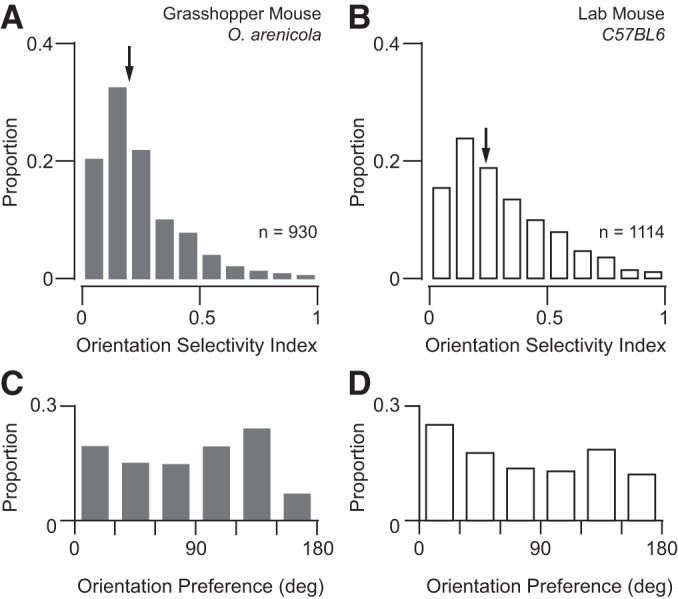
Distributions of orientation selectivity and preference from two-photon imaging. (A–B) Distributions of orientation selectivity index (OSI) from calcium responses for grasshopper and lab mice (respectively). Arrows indicate median values for each population. (C–D) Distributions of orientation preference from neurons with an OSI at least greater than 0.15 for grasshopper and lab mice (respectively).