Fig. 1.
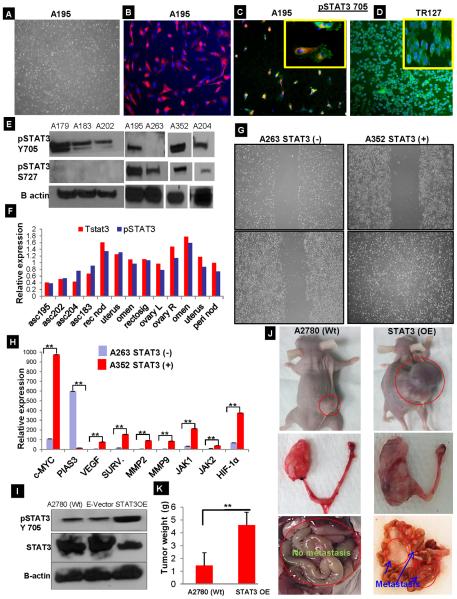
Isolation and characterization of ascites derived cancer cells. (A) Ascites fluid was collected from consented ovarian cancer patients and cultured on a T-75 flask. At the end of 18 hours, the ascites-derived cancer cells (ADOCCs) were attached to the bottom of the plate (4X magnification). (B) The ADOCCs (A195) were characterized for their epithelial origin using the epithelial-exclusive marker EpCam, which appears red in the picture (10X magnification). (C) ADOCCs (A195) stained for pSTAT3 705 (green) showed intracytoplasmic accumulation in 98–99% of the cell population (10X magnification). The inset shows a close-up of the cells (20X magnification). (D) pSTAT3 705 in TR127 cells (ascites derived immortalized cell line) displaying nuclear accumulation of pSTAT3. (E) Western blot of STAT3 proteins from different ADOCCs collected from different patients. A263 lacked pSTAT3 705 expression and A352 had a higher STAT3 expression compared to samples from other subjects; these two samples were used for subsequent experiments. (F) Ascites fluids, samples from primary ovarian tumor and metastatic sites in different patients were collected; protein extracted from these samples was subjected to pSTAT3 and total STAT3 ELISA assays. Primary ovarian tumor and the metastasized sites had shown the highest levels of pSTAT3 Tyr705 expression. (G) The cells with higher (A352) and lower (A263) STAT3 expression were subjected to wound healing assays in order to understand the correlation between STAT3 expression level and migration capability. The top panels show the plates at 0 hr after scratch and the bottom panels show the migration pattern after 24 hours. The cells over-expressing STAT3 (A352) migrate and close the gap within the first 24 hours (bottom right) while the cells with lower STAT3 expression (A263) do not (bottom left). (H) RNA was extracted from the higher STAT3 (A352) and lower STAT3 (A263) expression ascites and subjected to real time PCR after reverse transcription. As is evident from the figure, the STAT3-associated genes were expressed at higher levels in the cells expressing higher levels of STAT3 (A352). The experiment was repeated 3 times with 4 replicates per sample. ** over the bars in the graph indicates a p value ≤ 0.005 (I) In order to create STAT3 overexpression cells, A2780 cells were transfected with a vector harboring STAT3 gene (STAT3 OE) or with the empty vector backbone (E-Vector) for control. The OE was confirmed using Western blot. (J) The panel shows orthotopic mice injected with A2780 Wt and STAT3 overexpression (STAT3 OE) cells. Each mouse developed a big tumor and ascites within 2 weeks of injection; peritoneal, hepatic, and intestinal metastases were observed. The tumor weight was significantly higher in STAT3 OE transplanted mice compare with A2780 (Wt) type tumor ((p value ≤ 0.005).

