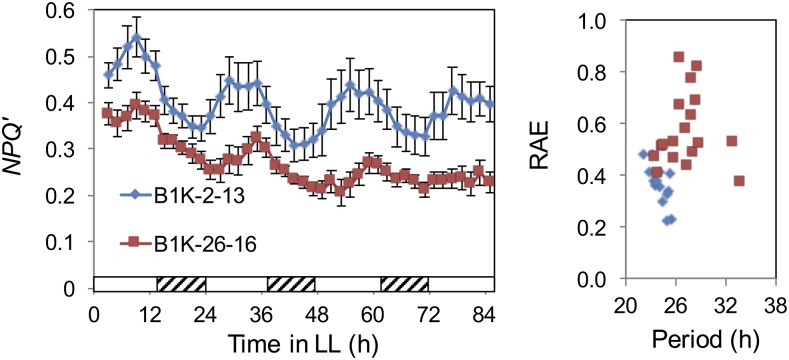
Figure 4.
Circadian rhythms are accession dependent. NPQ oscillations are shown in two B1K lines from different geographic locations. B1K-02-13 is from Yeruham at 535 m above sea level, and B1K-26-16 is from Ein Gev at 158 m below sea level. The left graph shows circadian rhythms, and the right graph shows RAE. The NPQ graph was plotted with the se.

