Figure 7.
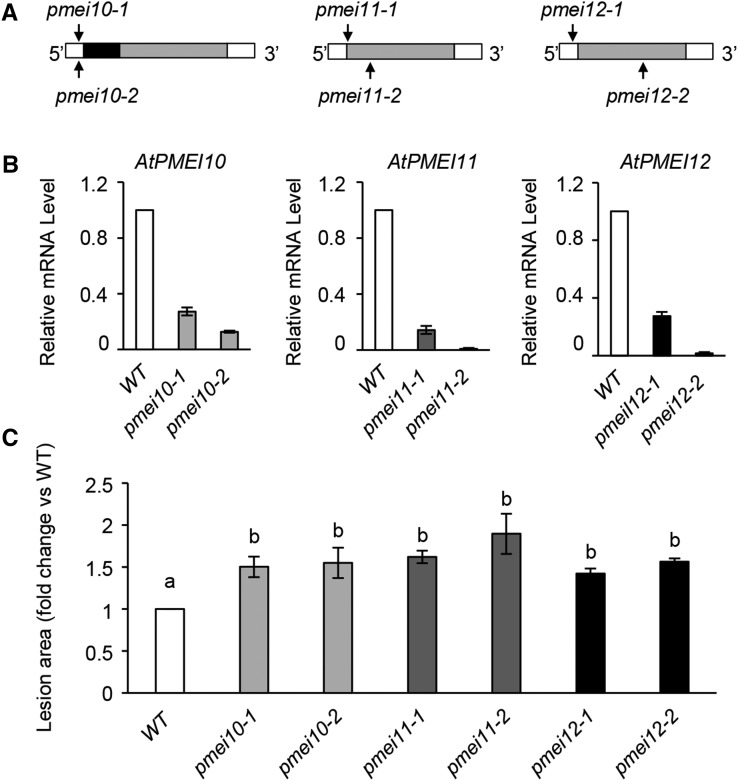
Arabidopsis pmei10, pmei11, and pmei12 mutants are more susceptible to B. cinerea. A, Schematic representation of PMEI gene structures. The localizations of T-DNA and transposon insertions in the genomic DNA sequences are shown (black arrows). The 5′ untranslated region (UTR) and 3′ UTR are represented in white, and exons are represented in gray. The SPRR domain is represented as a black block in PMEI10. B, The expression of PMEI genes was analyzed by qPCR using cDNA from leaves of 6-week-old wild-type (WT) and mutant plants at 48 hpi with B. cinerea. The expression levels were normalized to UBQ5 expression. The relative mRNA levels are represented as the ratio between gene expression in the mutants and that in the wild type. Results represent means ± sd of three independent experiments (n = 3). C, Quantification of lesion areas produced by the spreading of the fungus at 48 hpi. The values are means ± sd of three independent experiments (n = 30). Different letters indicate data sets significantly different according to ANOVA followed by Tukey’s test (P < 0.05).

