Figure 7.
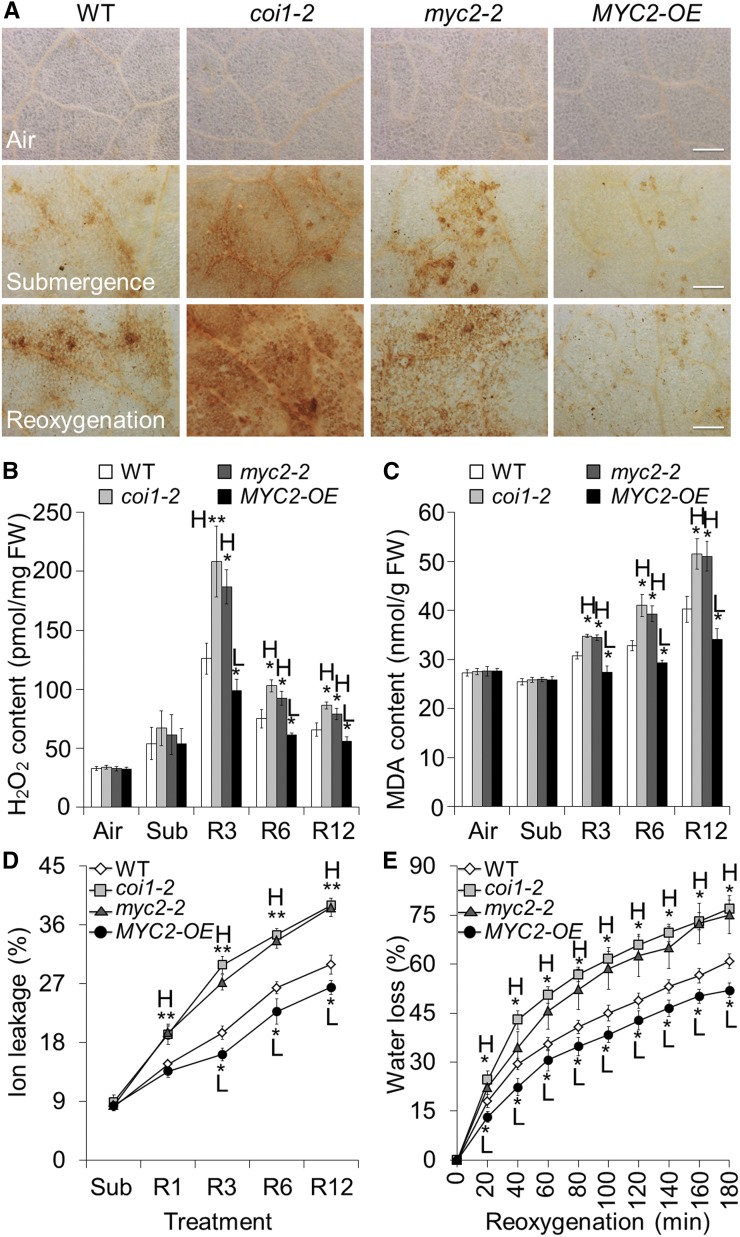
Analyses of ROS contents in wild-type (WT), coi1-2, myc2-2, and MYC2-OE plants in response to reoxygenation. A, DAB staining showing the accumulation of ROS in the leaves of 4-week-old WT, coi1-2, myc2-2, and MYC2-OE plants before submergence (Air) and after 24 h dark submergence (Submergence) followed by 6 h reoxygenation (Reoxygenation). In contrast to the WT leaves, a weak ROS signal was observed in the MYC2-OE plants while strong ROS accumulation was detected in the coi1-2 and myc2-2 mutants during reoxygenation. Bars = 500 μm. B and C, Contents of H2O2 (B) and MDA (C) in the 4-week-old WT, coi1-2, myc2-2, and MYC2-OE plants before submergence (Air) and after 24 h dark submergence (Sub) followed by 3, 6, and 12 h reoxygenation (R3, R6, and R12). D, Electrolyte leakage in the 4-week-old WT, coi1-2, myc2-2, and MYC2-OE plants after 24 h dark submergence (Sub) and reoxygenation for 1, 3, 6, and 12 h (R1, R3, R6, and R12). E, Water loss in the 4-week-old WT, coi1-2, myc2-2, and MYC2-OE leaves immediately after 24 h dark submergence (which was set to 0 min) and reoxygenation for 20, 40, 60, 80, 100, 120, 140, 160, and 180 min. All of the experiments were performed in triplicate with similar results. The data are means ± sd (n = 6 technical replicates). Asterisks indicate significant differences from WT (*P < 0.05; **P < 0.01 by Student’s t test). “H” and “L” indicate values that are significantly higher or lower, respectively, in the mutants or transgenic lines than in the WT.

