Figure 6.
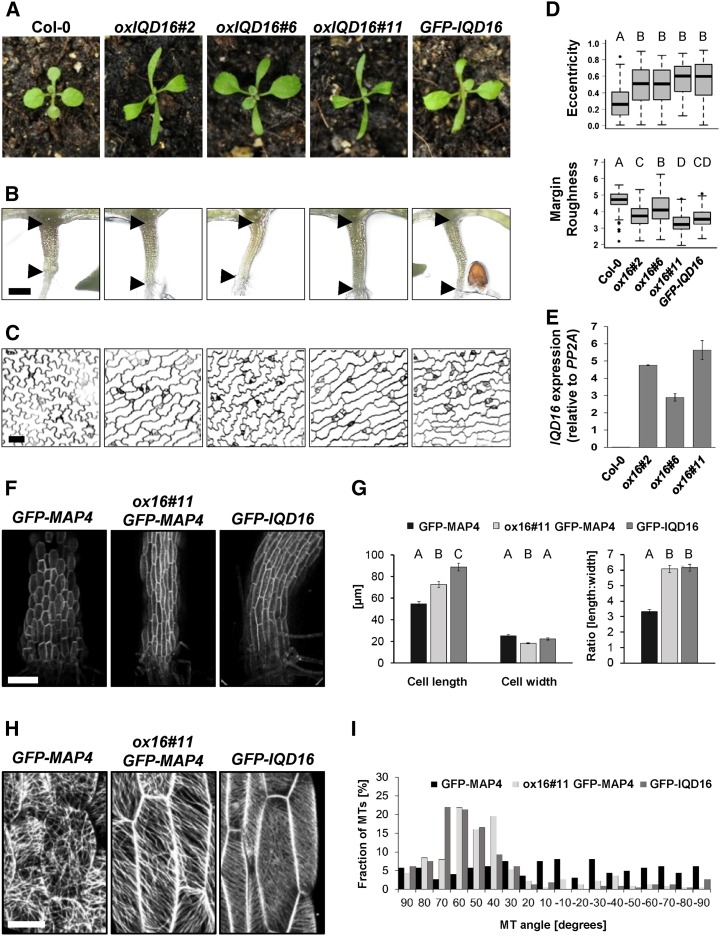
IQD16 overexpression alters epidermal cell shape and cortical MT orientation. A to C, Phenotypes of Arabidopsis wild-type plants and IQD16-overexpressing plants grown under long-day conditions. Shown are representative images of shoots of the wild type (Col-0), three independent transgenic Pro-35S:IQD16 lines (ox16#2, ox16#6, and ox16#11), and one transgenic Pro-35S:GFP-IQD16 line (GFP-IQD16). A, Two-week-old plants grown on soil. B, Seven-day-old seedlings grown under sterile conditions. Arrowheads delimit hypocotyls, which are elongated in IQD16-overexpressing plants. Bar = 0.5 mm. C, Single optical sections of adaxial epidermal pavement cells in cotyledons of 5-d-old seedlings. Cell walls were visualized with PI. Bar = 50 µm. D, Quantification of the cellular eccentricity and margin roughness in cells shown in C. Results are medians from n ≥ 70 cells and n ≥ 3 seedlings, and boxes range from first to third quartiles. Different letters denote a significant statistical difference. P < 0.005 by one-way ANOVA. E, Quantitative reverse transcription (RT)-PCR analysis of IQD16 transcript levels relative to PP2A in the three individual Pro-35S:IQD16 transgenic lines shown in A in comparison with the wild type (Col-0). Results are averages of three replicates ± se. F and G, Analysis of MT organization and cell shape in transgenic seedlings expressing Pro-35S:GFP-MAP4 (GFP-MAP4), Pro-35S:IQD16 and Pro-35S:GFP-MAP4 (oxIQD16#11 GFP-MAP4), or Pro-35S:GFP-IQD16 (GFP-IQD16). Seedlings of stably transformed Arabidopsis lines (5 d old) were grown on Arabidopsis salt medium under long-day conditions. F, Z-stack projections of hypocotyl epidermis cells. Bar = 100 µm. G, Epidermal hypocotyl cell size. Cell length and cell width were measured relative to the perpendicular axis, and the length-to-width ratio of individual cells was calculated (means ± se, n = 33 cells of three seedlings; Different letters denote a significant statistical difference. P < 0.005 by Student’s t test). H, Z-stack projections of individual epidermal hypocotyl cells. Bar = 20 µm. I, Quantification of cortical MT orientation. Angles were measured relative to the perpendicular axis, and relative fractions were calculated (n = 225 MTs, with three independent experiments).

