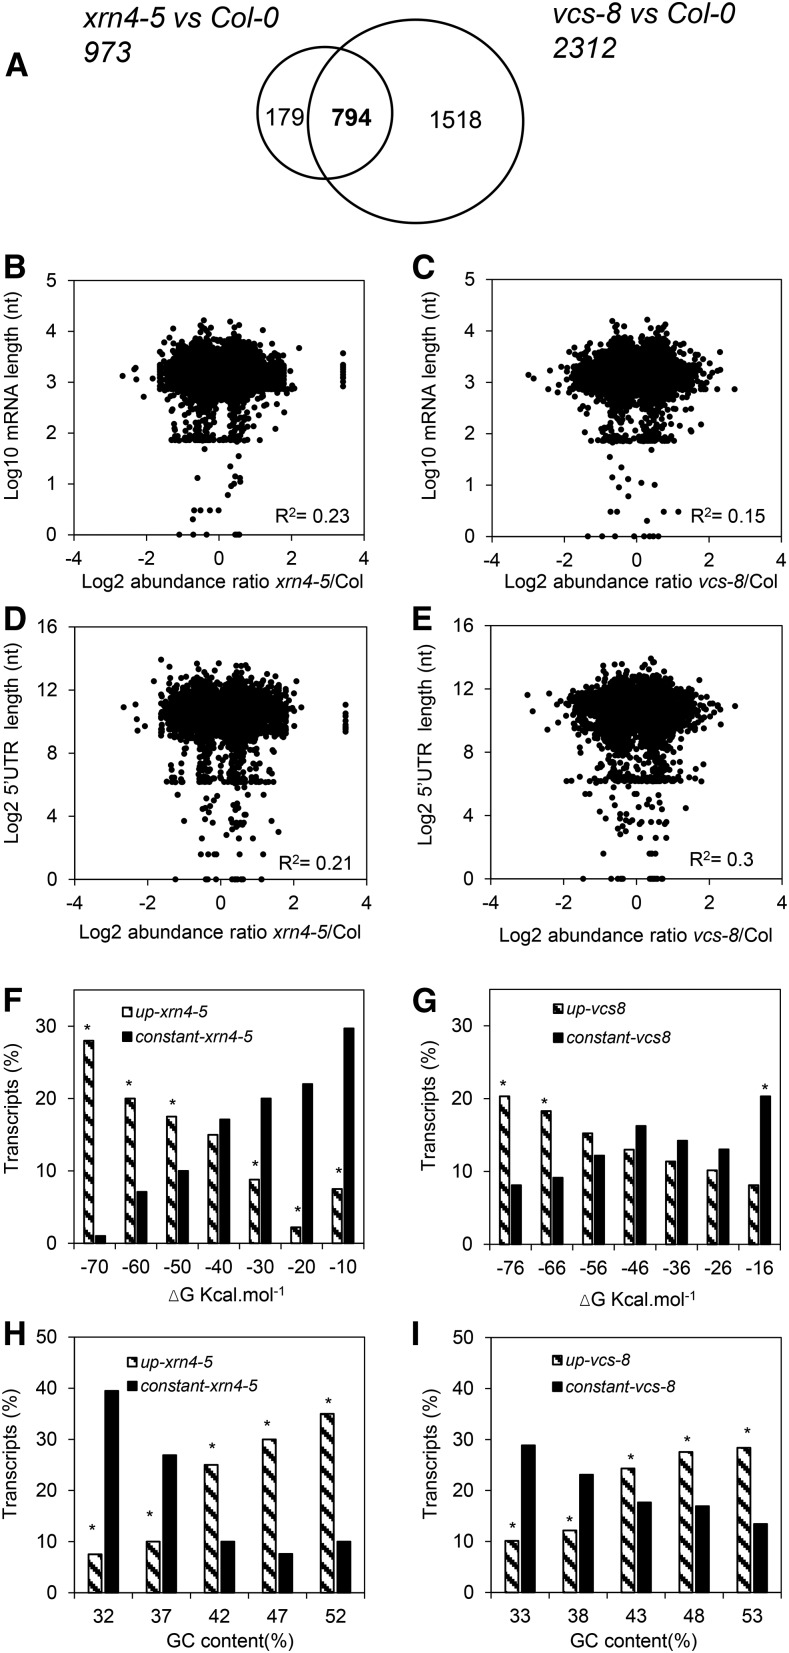
Figure 3.
mRNA decay modifies the seed transcriptome and is related to transcript features. A, Venn diagram showing the number of transcripts displaying significant increases in abundance (after Benjamini and Hochberg correction; ratio > 0.5) in xrn4-5 and vcs-8 mutants compared with wild-type Col-0 after 24 h of imbibition at 25°C. Totals of 973 and 2,312 transcripts more abundant in xrn4-5 and vcs-8 mutants, respectively, were identified. B and C, Relationship between mRNA total length and mRNA abundance in xrn4-5 (B) and vcs-8 (C) mutants. Each point of the scatterplots represents log10 (mRNA total length) on the x axis versus the ratio of change in mRNA log2 expression (mutant to Col-0) on the y axis for transcripts more abundant in mutant seeds. nt, Nucleotides. D and E, Relationship between the length of mRNA 5′ UTRs and mRNA abundance in xrn4-5 (D) and vcs-8 (E) mutants. Each point of the scatterplots represents log2 (5′ UTR length) on the x axis versus the ratio of change in mRNA log2 expression (mutant to Col-0) for transcripts more abundant in mutants on the y axis. F and G, Distribution of transcripts specifically more abundant in xrn4-5 (F) and vcs-8 (G) mutants (striped bars) and of transcripts displaying no significant change in abundance (black bars), compared with Col-0, as a function of the minimal free energy (ΔG) of secondary structure. mRNA classes were clustered based on the free energy of their secondary structure using a 10 kcal mol−1 step. The distribution of up-accumulated or constant transcripts in xrn4-5 and vcs-8 seeds was statistically different, as determined by χ2 test (P < 0.05). H and I, Distribution of transcripts specifically more abundant in xrn4-5 (H) and vcs-8 (I) mutants (striped bars) and of transcripts displaying no significant change in abundance (black bars), compared with Col-0, as a function of their GC content. mRNAs classes were clustered based on the free energy of their secondary structure using a 5% GC content step. The distribution of up-accumulated or constant transcripts in xrn4-5 and vcs-8 seeds was statistically different, as determined by χ2 test (P < 0.05).

