Figure 2.
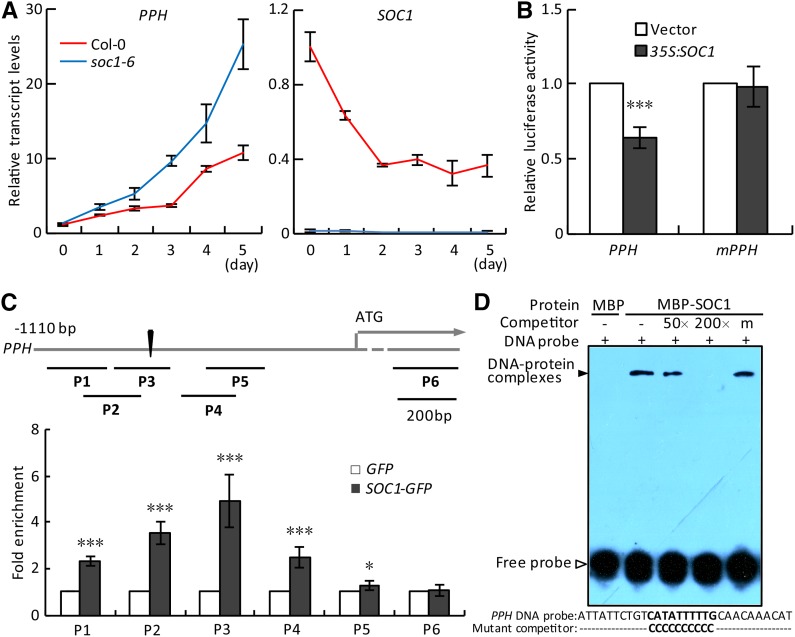
SOC1 negatively regulates the expression of PPH by binding to its promoter. A, Relative transcript levels of PPH (left) and SOC1 (right) were analyzed by reverse transcription (RT)-quantitative PCR (qPCR) in the detached fifth and sixth rosette leaves of Columbia-0 (Col-0) and soc1-6 during dark treatment. The levels of PPH and SOC1 in Col-0 at day 0 were set to 1. B, PPH promoter activity was inhibited directly by overexpressing SOC1 in protoplasts in a dual-luciferase assay. Vector, Empty vector control; mPPH, the PPH promoter with mutations in the CArG box. C, ChIP-qPCR analysis of the association of SOC1 with the PPH promoter in vivo. Top, A schematic diagram of the PPH promoter showing the positions of the CArG box (black triangle) and six ChIP amplicons (P1–P6). Bottom, Fold enrichments of six amplified fragments were quantified by qPCR assay with chromatins isolated from 35S:SOC1-GFP as well as 35S:GFP lines. D, EMSA verification of the direct binding of SOC1 to the PPH promoter in vitro. MBP, Recombinant maltose-binding protein; MBP-SOC1, recombinant MBP-SOC1 protein; DNA probe, a 30-bp biotin-labeled PPH promoter fragment containing the wild-type CArG box was used as the probe; Competitor, nonlabeled wild-type fragment (50- or 200-fold excess) or the fragment with the CArG box mutated (200-fold excess). The black arrowhead points to DNA-protein complexes; the white arrowhead points to free probe. − and + represent absence and presence, respectively; m represents the mutated competitor. The 30-bp probe and mutated competitor sequence are shown below the EMSA image, with wild-type and mutated CArG boxes in boldface. The signal of biotin-labeled DNA was exposed to x-ray film. In A and C, data are means ± sd of two biological repeats; in B, data are means ± sd of three biological repeats. *, P < 0.05 and ***, P < 0.001 (Student’s t test).

