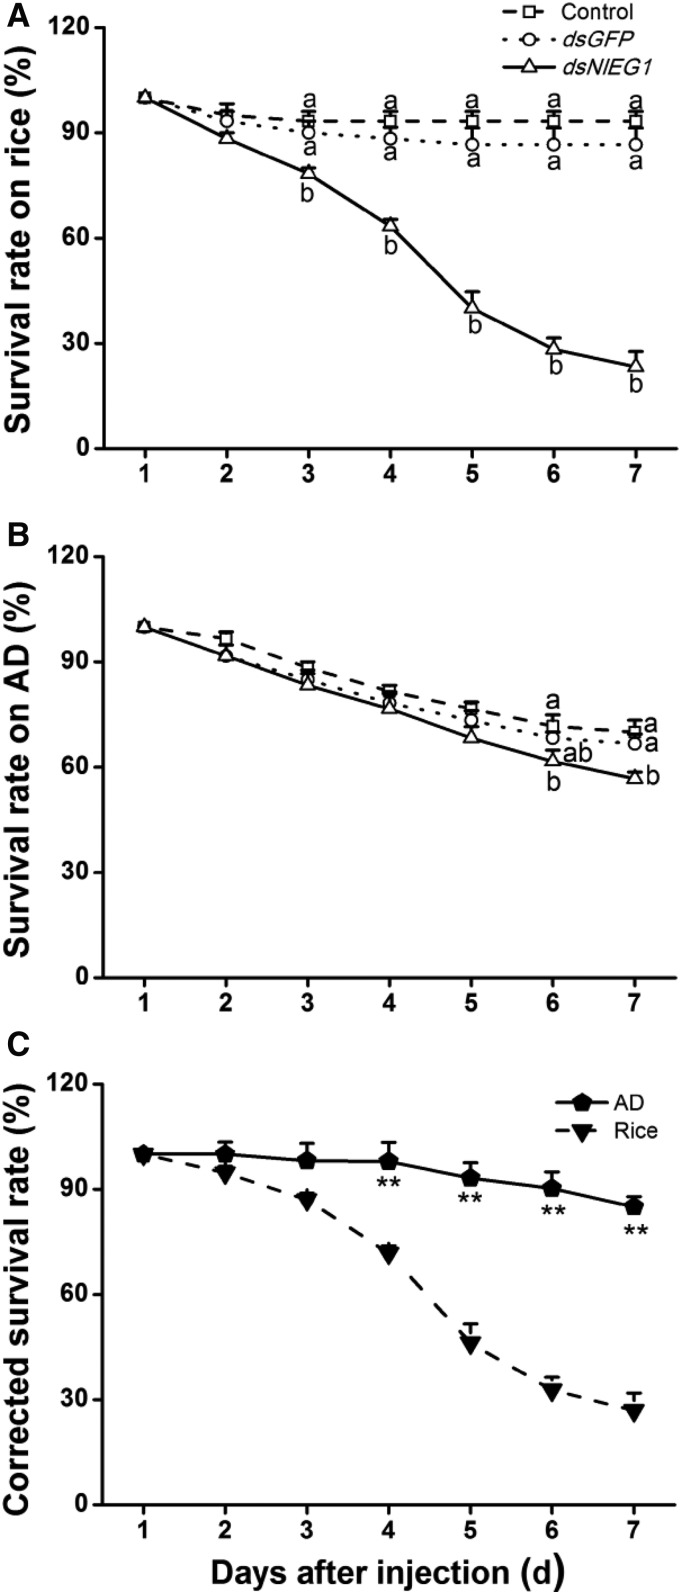
Figure 6.
Knocking down NlEG1 decreases survival rates among BPH nymphs. A and B, Mean survival rates + se (n = 4) of BPH nymphs that had been injected with dsRNA of NlEG1 (dsNlEG1) or GFP (dsGFP) or kept noninjected (control) at the third-instar nymph stage, feeding on rice (A) or artificial diet (AD; B). Letters indicate significant differences among different treatments (P < 0.05, Duncan’s multiple range test). C, Mean corrected survival rates + se (n = 4) of BPH nymphs with injected NlEG1 dsRNA, using BPH nymphs with injected GFP dsRNA as controls, feeding on rice or artificial diet. Asterisks indicate significant differences between treatments (P < 0.01, Student’s t test).

