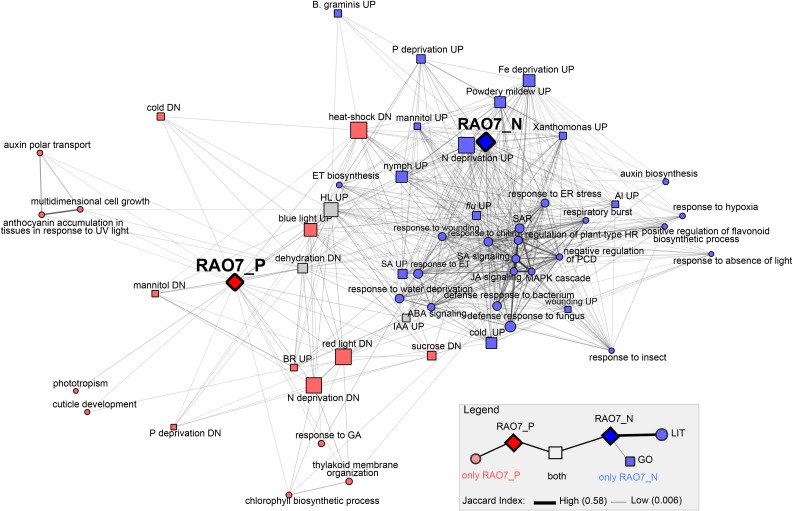
Figure 6.
Correlation of the MYB29-regulated gene sets with functional annotations. The MYB29 positively and negatively regulated genes (RAO7_P and RAO7_N) were used for gene set enrichment analysis with GO BP (FDR < 3.00E-05; see Supplemental Fig. S5) and DE genes (UP, up-regulated; DN, down-regulated) after hormone or stress treatments, the latter obtained from the literature through the PlantGSEA tool (FDR < 3.00E-03; Yi et al., 2013). Afterward, all gene lists were compared with each other in a pairwise manner. Only gene list pairs with significant overlap (FDR < E-03) and containing at least 10% of genes from either or both gene sets were used for network construction, and only gene sets directly connected to RAO7_P or RAO7_N were retained. Edge thickness and distance in the network correspond to the Jaccard index of similarity. Node shape indicates the type of gene list (squares, GO BP; circles, DE gene lists from the literature [LIT]). Node color refers to whether nodes are connected only with RAO7_P (red), only with RAO7_N (blue), or with both (gray). HL, high light; HR, hypersensitive response; IAA, indole-3-acetic acid; PCD, programmed cell death; SAR, systemic acquired resistance.

