Figure 6.
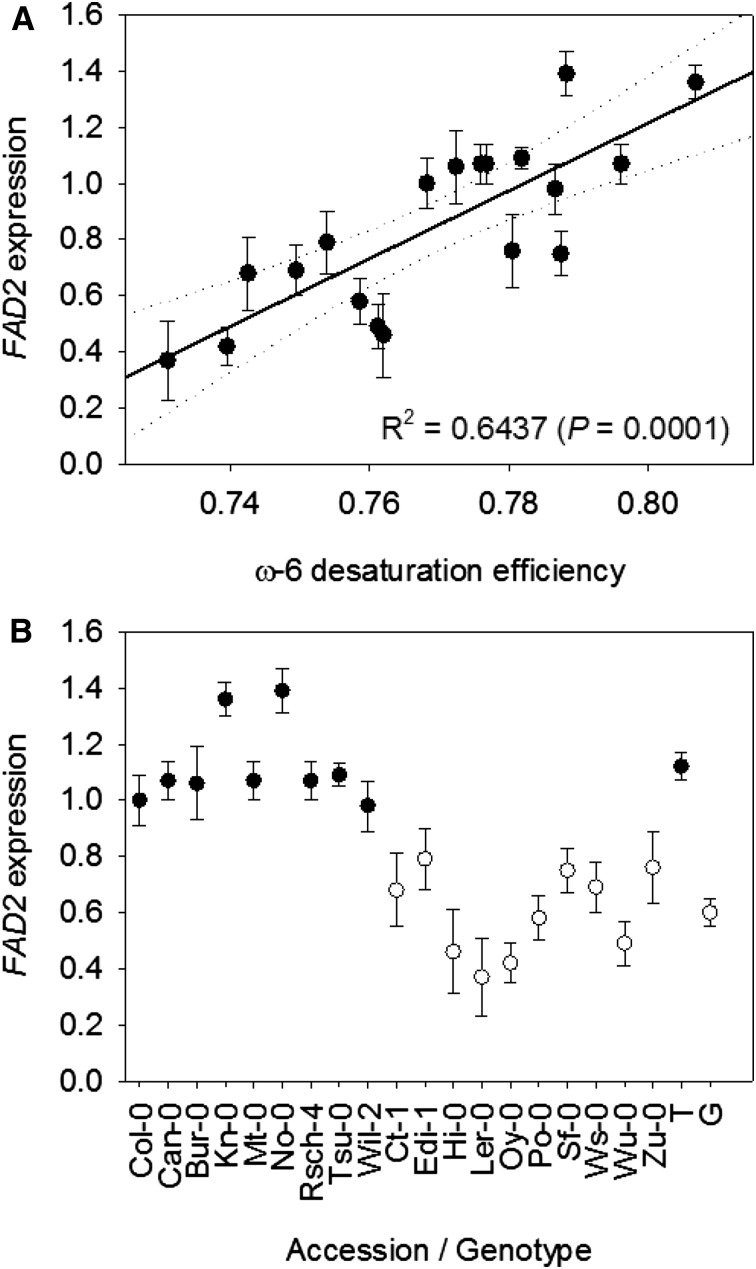
FAD2 expression analysis in the 19 founder accessions of the MAGIC population. Relationships between expression and ω-6 DE (A) and expression and genotype at P1 (3,862,256 bp on chromosome 3; B) are shown. Quantitative PCR was performed on RNA from seeds of five separate plants of each genotype, and values are normalized to Col-0 and expressed as means ± se. In A, the dotted lines mark the 95% CI. In B, black circles represent accessions that have nucleotide variant T and white circles represent accessions that have nucleotide variant G. The averages shown on the left are significantly different (P < 0.0001).

