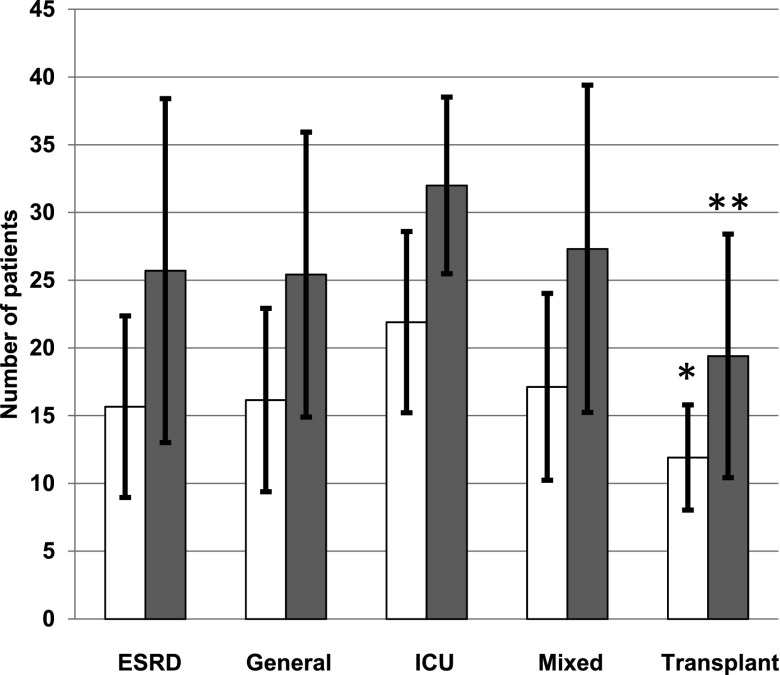
Figure 2.
Census characteristics of different services based on intended patient population. Mean (±SD) number of patients on average (white bars) and at their maximum (gray bars) for different intended service populations. *P=0.01 versus ESRD, P=0.001 versus general, P<0.001 versus ICU, P=0.001 versus mixed; **P=0.03 versus ESRD, P=0.001 versus general, P=0.01 versus ICU, P=0.002 versus mixed. ICU, intensive care unit.

