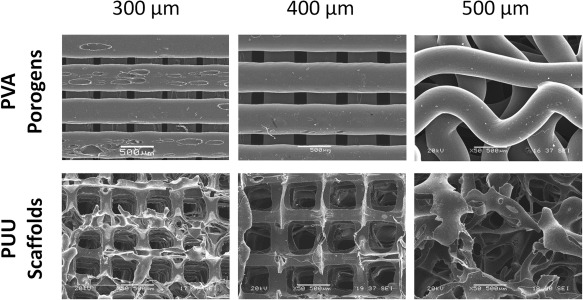
Figure 2.

SEM images of the PVA porogens in the three different sizes (above) and the PUU scaffolds (below) that they generated. The displayed images were taken of the XY plane of the porogens/scaffolds (parallel to the fiber/channel direction). The stacks of 300 and 400 μm thick porogens created aligned channels in the PUU scaffolds. The 500 μm thick porogens deformed under their own weight, resulting in a distorted scaffold architecture. The scale bar represents 500 μm.
