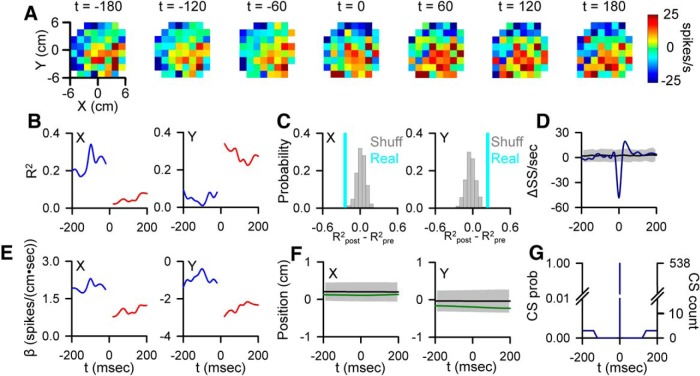
Figure 4.
CS-coupled switch in SS encoding. A, Firing maps illustrating an example cell SS modulation with position relative to CS occurrence (t = 0). B, Pre- and post-CS encoding strength of X and Y (conventions as in Figs. 2, 3). C, Magnitude of the CS-coupled change in SS encoding of X (left) and Y (right) in the ±100 ms window (indicated by the light blue lines) relative to the distribution of profiles aligned to randomized CS times selected outside the actual CS window (gray bars). D, CS-triggered average of SS firing (blue trace) relative to the SS variability CS-shuffled ISIs (mean ± 3 SDs, gray region). E, Pre- and post-CS SS firing sensitivity for this cell to X (left) and Y (right) (conventions as in Figs. 2, 3). F, CS-triggered average of X (left, green trace) and Y (right) relative to the variability from CS-shuffled ISIs (mean ± 3 SDs, gray region). G, Occurrence of additional CSs in the ±200 ms window centered on CS discharge (left axis, CS probability; right axis, CS count).

