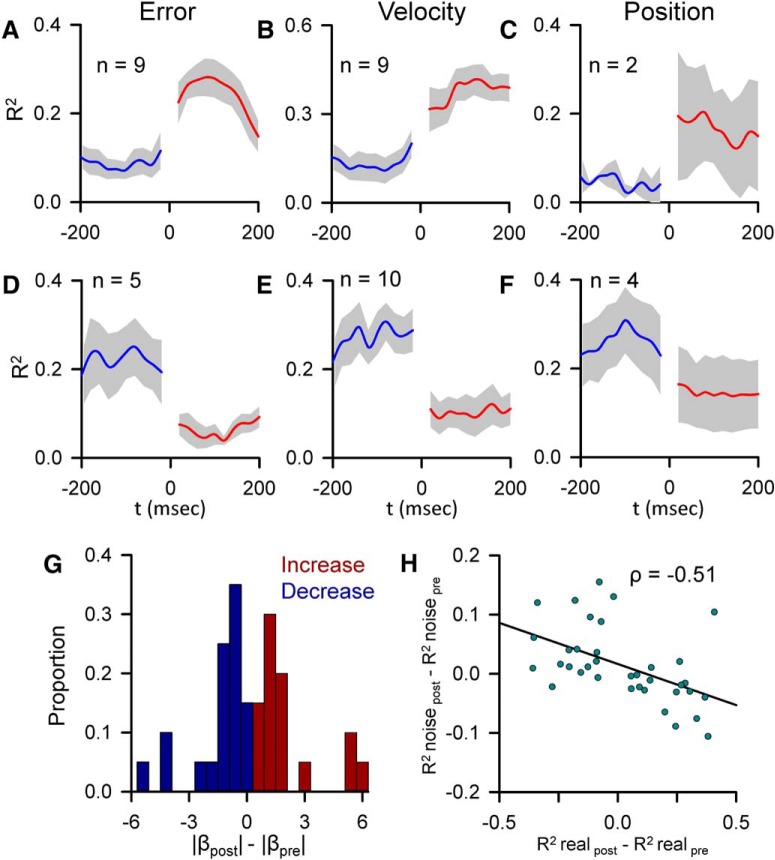
Figure 5.
Population summary of CS-coupled changes in encoding and sensitivity. A–F, Mean of the pre- and post-CS R2 profiles for each parameter with a significant CS-coupled encoding change (blue represents pre-CS; red represents post-CS) ± SEM (gray areas). Increases and decreases in encoding are grouped separately. n indicates the number of profiles. G, Population distribution of changes in SS sensitivity with significant CS-coupled changes in encoding (blue bars represent encoding decreases; red bars represent encoding increases). Proportions for increases and decreases were computed separately. H, Distribution of the magnitude of CS-coupled encoding changes versus mean magnitude of encoding changes not associated with CS firing for all significant CS-coupled encoding changes across the population (n = 40). The Pearson correlation coefficient is included. Line indicates the significant trend of the distribution (p = 0.003).

