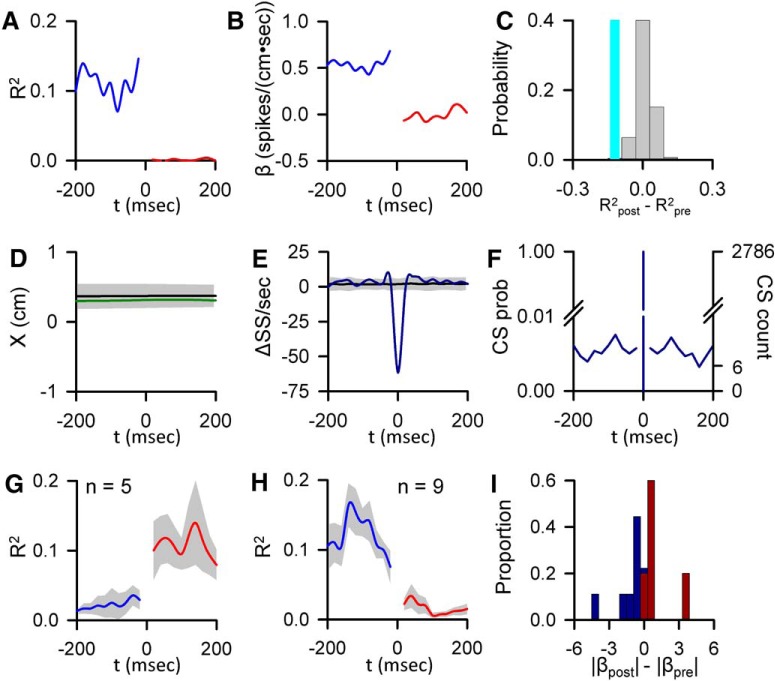
Figure 6.
CS-coupled changes in encoding of parameters not initially determined to be significant. A, Encoding strength (R2) of X position before (blue trace) and after (red trace) CS occurrence for an example Purkinje cell. B, Sensitivity (β) of same cell to X, before (blue trace) and after (red trace) CS discharge. C, Magnitude of the CS-coupled change in SS encoding strength in the ±200 ms window (indicated by the light blue bar) relative to the distribution of profiles aligned to randomized CS times selected outside the real CS (gray bars). D, CS-triggered average of X (green trace) relative to the X variability from CS-shuffled ISIs (mean ± 3 SDs, gray region). E, CS-triggered average SS firing (blue trace) relative to the SS variability from CS-shuffled ISIs (mean ± 3 SDs, gray region). F, Distribution of additional CSs in the −200 to 200 ms intervals centered on CS occurrences (left axis, CS probability; right axis, CS count). G, H, Mean of R2 profiles showing significant CS-coupled increases (G) and decreases (H) in encoding (mean ± SEM) with the number of profiles denoted by n. I, Population distribution of changes in SS sensitivity to for these parameters with significant CS-coupled changes in encoding (blue bars represent encoding decreases; red bars represent encoding increases).

