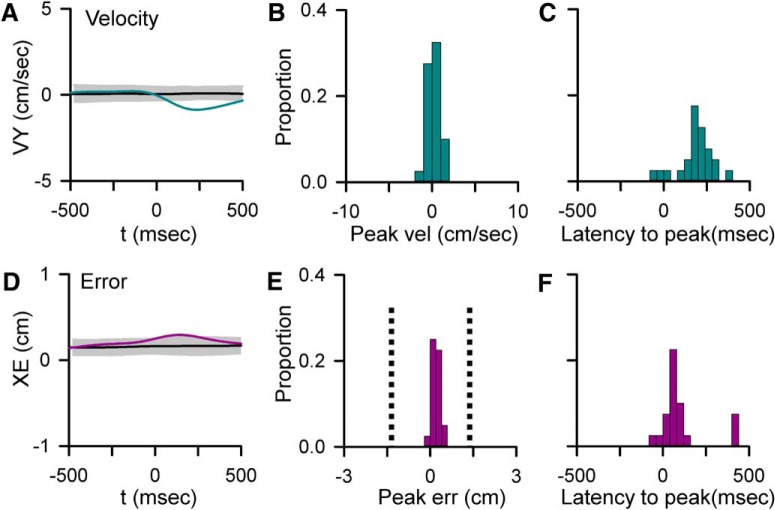
Figure 7.
Relationships between CS firing and behavior. A, D, Examples of significant CS-coupled changes in VY (A, blue trace) and XE (D, purple trace) as determined by comparison with mean CS-shuffled control (black trace) ±3 SDs (gray region). B, E, Distributions of peak changes in velocity (B) and error (E) in the 22 Purkinje cells with significant CS-coupled changes in behavior. E, Vertical dashed line indicates the target edge. C, F, Timing of peak changes in velocity (C) and error (F) illustrating that behavioral changes lag CSs.

