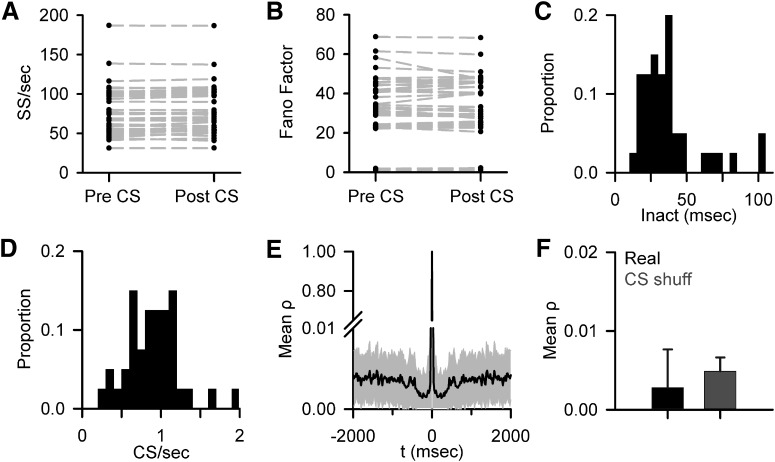
Figure 9.
No evidence for CS-associated changes in SS firing properties or CS rhythmicity. A, Mean SS firing before and after CS discharge based on the 200 ms pre-CS and 200 ms post-CS windows (mean ± SD of the inactivation period) for 39 of 40 recorded Purkinje cells. As described in Materials and Methods, one cell was excluded due to high SS variability following the CS; however, this cell did not have significant SS encoding changes. B, Mean Fano factor pre- and post-CS using the same window in A for 39 of 40 recorded Purkinje cells. C, Distribution of mean SS inactivation periods after CS discharge (Inact) for all 40 Purkinje cells. D, Histogram of mean CS firing rate for all 40 Purkinje cells. E, Population average of CS discharge autocorrelation (mean ± SD). Note the discontinuous y-axis. F, Average maximum autocorrelation in the 8–12 Hz range for CS firing (Real) and randomly shuffled control data (CS shuff). Error bars indicate SD.

