Figure 6.
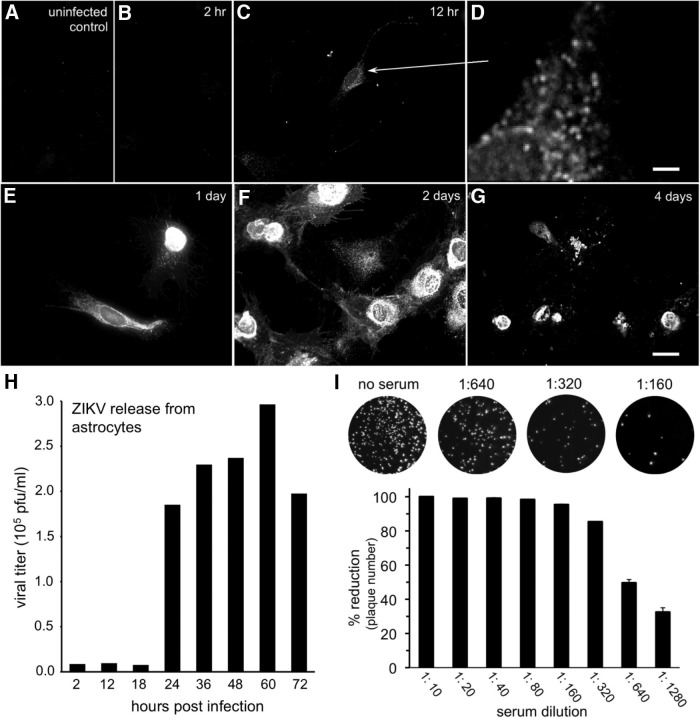
Time course of ZIKV infection of brain cells. Primary human brain cells, mostly astrocytes, were inoculated at time 0, then fixed and immunostained at the indicated intervals. Immunoreactivity was not seen in uninfected control cultures (A) or at 2 h (B) post inoculation (hpi). C, D, At 12 hpi, faint immunoreactivity was detected in granules (D, enlarged region shown by arrow). Scale bar, 2.5 μm. Immunoreactivity became stronger up to 2 d (E, F) post inoculation (dpi). G, By 4 dpi, many of the immunoreactive cells were dead or dying. Scale bars: A–C, E–G, 25 μm. H, Viral release was measured using additional cultures infected after ZIKV (multiplicity of infection 20) inoculation for 1 h, then washed and supplied with fresh media. Media samples were harvested at the indicated time points, and viral concentration was measured by plaque assay. I, ZIKV antiserum harvested from inoculated rats and used for immunolabeling was tested for the ability to neutralize ZIKV infection in vitro. Top, Counterstained cultures show the decline in viral plaque number after exposure to increasing concentrations of antiserum, corroborating antibody selectivity. Bottom, Bar graph indicates that a 50% reduction in ZIKV plaque number was obtained at 1:640 antiserum dilution. Error bars indicate SEM (n = 4).

